
Every Facebook advertiser knows the feeling of staring at a wall of Ads Manager data, wondering which numbers move revenue. When you track dozens of metrics simultaneously, crucial signals get buried under noise.
This guide breaks down the essential Facebook ad metrics by funnel stage to show you what each data point measures, how to calculate it, and how to use connected metrics to fix performance drops fast.
Why most Facebook ad reports miss the point
Most Facebook ad reports dump numbers onto a slide and call it a day. You see impressions up, CPC down, or ROAS swinging wildly from Tuesday to Thursday. But a spreadsheet full of raw metrics doesn't tell you what to do next.
Metrics are diagnostic tools.
Tracking data only matters when it reveals why a campaign succeeds or fails. You end up fixing the wrong problems when you treat metrics as isolated signals. You swap out targeting when your audience became fatigued. You kill a winning campaign because an attribution window closed early.
Good performance tracking isolates the root cause behind every shift. You need a clear map of how these numbers influence each other.
Delivery metrics: Is your ad even reaching people?
Delivery metrics tell you if Meta's auction system wants to display your ads at all. Before you evaluate clicks or sales, you need to verify if your ads get enough inventory in the feed.
Impressions and reach
Reach tracks the number of unique people who saw your ad. Impressions count the total times your ad appeared on a screen, including repeat views by the same person.
Reach = Unique Users Exposed
Impressions = Total Times Displayed
When reach stalls while your budget stays flat, Meta is struggling to match your ad with audience inventory. This usually signals overly narrow targeting choices or an aggressive bid cap that drops your ad out of competitive auctions.
CPM (Cost per 1,000 impressions)
CPM measures what Meta charges you to display your ad 1,000 times in the feed.
A sudden spike in CPM without targeting edits usually means Meta's system is rating your ad experience poorly. Tired creative tends to lose auction priority, which pushes up what you pay for the same inventory.
Frequency
Frequency shows the average number of times a single user sees your ad over a specific period.
Every audience hits a threshold where repetition turns into fatigue. Many advertisers see fatigue emerge once frequency creeps past 3.0 on cold traffic, a commonly cited threshold rather than a Meta-published figure.
Past that point, users start ignoring the image, and cost per acquisition tends to jump.
Engagement metrics: Is the creative landing?
Engagement metrics reveal how well your creative stops the scroll. They measure whether your hook, copy, and visuals pull users out of passive scrolling and force them to interact.
CTR (Click-through rate)
CTR shows the percentage of total impressions that resulted in a click.
Always focus on CTR (Link Click-Through Rate) rather than total CTR, which includes simple image taps or expanded post text. Typical link CTR ranges vary by objective, generally landing between 1.0% and 2.2% for Traffic and Sales campaigns, and higher for Lead Gen (see the benchmark table below).
A low CTR usually points to an asset problem:
- Under 0.80%: This often signals your visual hook isn't grabbing attention in the first 3 seconds.
- High total CTR, low link CTR: This pattern usually points to your offer or ad copy failing to push users toward the destination link.
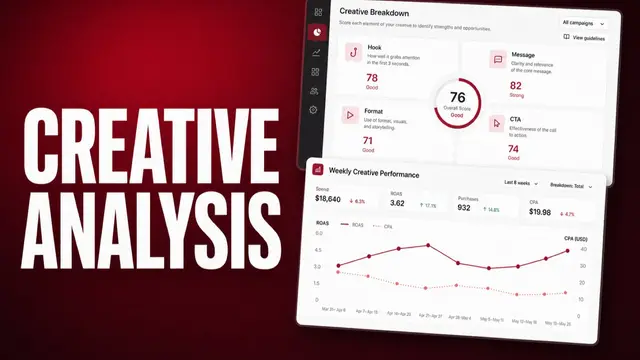
Telling these two apart from a metrics table alone is tricky. Creative analysis tools flag which part of the ad is losing people before you rebuild the wrong half.
Post engagement (reactions, comments, shares, saves)
Post engagement tallies all direct social actions on your ad, in the form of likes, comments, shares, and saves.
While top-of-funnel conversion campaigns prioritize link clicks, social actions can still influence Meta's auction algorithms. High comment counts and frequent shares tend to read as positive signals, which can help keep your CPMs down.
Shares provide free distribution, while negative comments or hidden posts tend to push delivery costs up.
Cost and efficiency metrics: what are you paying for?
Cost metrics show how efficiently your budget moves users through the funnel. They help you evaluate if Meta charges a fair price for the actions your campaign generates.
CPC (Cost per click)
CPC tracks the average price you pay for every click on your ad.
A rising CPC indicates one of two distinct problems:
- Competition problem: If your CTR stays steady while CPM rises, this usually points to external bidding pressure driving up your costs.
- Relevance problem: If your CPM is stable while CTR drops, it often means your creative is losing its appeal to the audience.
Cost per result (CPA)
CPA measures the specific cost to generate a targeted conversion outcome, such as a lead, purchase, or app install.
Meta calculates this metric based on the specific campaign objective you select at setup. If you run the Sales objective and optimize for purchases, your cost per result equals your cost per acquisition.
Tracking CPA keeps you focused on real business outcomes, as opposed to intermediate steps like link clicks.
Performance metrics: is it working?
Performance metrics measure the bottom-line financial impact of your ad spend. They tell you if your campaigns generate revenue or burn your budget.
ROAS (Return on ad spend)
ROAS tracks the revenue generated for every dollar spent on ads.
If you spend $1,000 on Meta ads and generate $3,500 in sales, your ROAS is 3.5.
ROAS alone is misleading when you ignore profit margins or attribution lag. High-ticket products often show a low initial ROAS in Ads Manager because customers take days to decide.
Buying low-margin products at a 2.0 ROAS can mean losing money after factoring in product costs, shipping, and merchant fees.
Result rate/conversion rate
Result rate is Meta's built-in metric, calculated by dividing results by impressions. Conversion rate is the term most advertisers mean instead: the percentage of clicks that completed your target action, and it's the more useful one for spotting where users drop off.
Comparing link CTR with conversion rate pinpoints where users drop out:
- High CTR + Low Conversion Rate: This pattern usually means your creative makes a promise your landing page doesn't keep. Slow loading speeds, price shock, or poor message match are common culprits.
- Low CTR + High Conversion Rate: This signals your offer is strong, but your creative isn't getting enough qualified traffic to your site.
How these metrics talk to each other
One failing metric tends to trigger a chain reaction across your entire account.
Consider this standard scenario:
- Frequency creeps up: Your ad has run for three weeks without updates. Frequency moves from 1.8 to 3.4.
- CTR starts dropping: Users recognize the image instantly and scroll past. Your link CTR drops from 1.4% to 0.6%.
- CPM spikes: Meta notices users are ignoring the ad. The system penalizes your auction score, pushing CPM from $12 up to $26.
- CPA doubles: With higher CPMs and lower CTRs, your cost per acquisition jumps from $25 to $50.
If you only look at CPA, you might blame your landing page or widen your targeting. But tracing the metric sequence reveals the actual root cause, which is creative fatigue. Fixing the problem requires swapping out the visual asset.
The measurement gap
Before pulling the plug on a “failing” ad, keep Meta's data modeling in mind.
Signal loss from privacy updates means Meta frequently relies on statistical modeling to estimate conversion totals. Meta explicitly notes that breakdown views (like age, gender, or placement breakdowns) may fail to show attributed conversions due to partial data.
Sometimes, a sudden drop in reported conversions highlights a measurement gap instead of a creative or targeting collapse.
For a full walkthrough on diagnosing account drops, read our guide on Facebook Ad Performance Decline: Causes and Fixes.
Typical Facebook Ads ranges worth comparing against
Meta doesn't publish official cross-industry benchmarks, so treat the numbers below as typical patterns we see across active accounts. They’re not fixed targets or platform-published data. B2B lead generation operates on completely different auction dynamics than direct-to-consumer apparel.
The objective column matters because it changes what you're paying for. Traffic campaigns optimize for clicks to your site, Lead Gen optimizes for form fills and sign-ups, and Sales optimizes for purchases, so a $2 CPC that looks high for Traffic is normal for Lead Gen.
Match your own campaign's objective to the right column before judging your numbers against it.
Use these as a rough starting point for evaluation, then compare against your own account's history:
| Metric | Traffic Objective | Lead Gen Objective | Sales Objective |
|---|---|---|---|
| CTR (Link) | 1.5% - 2.2% | 2.5% - 4.0% | 1.0% - 1.8% |
| CPC | $0.70 - $0.90 | $1.80 - $3.50 | $1.20 - $2.50 |
| CPM | $12.00 - $18.00 | $25.00 - $40.00 | $18.00 - $30.00 |
| CPA / CPL | N/A | $18.00 - $45.00 | $30.00 - $60.00 |
Your target geography, choice of ad placement, and audience pool heavily shift these numbers. US inventory can cost several times more than emerging international markets for identical targeting.
Evaluate your performance against your account's historical trends before comparing your numbers to external industry averages.
Vanity metrics to stop reporting on
Not all numbers deserve space on your executive summary. Tracking low-intent engagement inflates your reported impact without reflecting real business growth.
Cut these three vanity metrics from your weekly reports:
- 3-Second Video Views without watch time: A 3-second view counts real watch time, not a stray pause, but three seconds is a low bar for real interest. Track completion rates or 15-second view totals instead to see if people stuck around.
- Raw Likes and Page Follows: Page likes don't correlate with revenue. High like counts look nice, but link clicks and conversions indicate real commercial interest.
- Reach without engagement: Generating high reach means nothing if users scroll past without acting. Reach only holds value when paired with strong click-through and conversion rates.
Tracking Facebook ad metrics without drowning in Ads Manager tabs
Managing account health across dozens of campaigns gets messy fast. Jumping between Ads Manager tabs to track custom breakdowns creates confusion and consumes hours of your week.
Focus on centralizing how you track Facebook ad metrics:
- Automate delivery alerts: Set up automated rules to flag sudden CPM spikes or steep CTR drops.
- Standardize custom columns: Group metrics by funnel stage (Delivery → Engagement → Performance) inside your default Ads Manager views.
- Streamline asset analysis: Use specialized creative reporting tools to evaluate hook rates and visual fatigue without manual spreadsheet exports.
Instead of stitching together custom exports, modern performance teams rely on dedicated software to handle the manual work.
Atria is the creative intelligence platform for Meta ads. Radar grades every asset element automatically, so you can find winning formulas and rebuild creative velocity before budget gets wasted.
It's part of a broader change, where more of the account-level grunt work is moving to AI tools for Facebook ads optimization, freeing up your time for the calls that need a human.
Want to start creating winning ads? Try Atria for free.
Frequently asked questions
What's the most important Facebook ad metric to track?
The most important Facebook ad metric to track, according to most advertisers, is cost per result (CPA), since it ties straight to business outcomes. CTR and CPM make better day-to-day diagnostics, though, catching creative problems before they show up in your CPA.
How often should I check my Facebook ad metrics?
Check top-level delivery metrics daily to spot broken tracking or runaway costs. Review creative performance metrics weekly to allow Meta's algorithm enough conversion volume before making major campaign edits.
What's a good CTR for Facebook ads?
Typical link CTR patterns run between 1.0% and 2.0% for e-commerce and direct response campaigns, and higher for lead generation, often 2.5% to 4.0%. Treat these as reference points, not fixed targets, since they shift by industry and placement.
Why do my Facebook ad metrics look different in Ads Manager vs. my dashboard?
Discrepancies happen due to differing attribution windows, privacy reporting delays, and server-side tracking setups. Third-party dashboards often track real-time pixel hits, while Meta relies on modeled conversions and specific click-through windows.
What's the difference between engagement metrics and performance metrics?
Engagement metrics (CTR, likes, shares, comments) measure how effectively your ad creative grabs attention in the feed. Performance metrics (CPA, ROAS, conversion rate) measure whether that attention translates into business revenue.