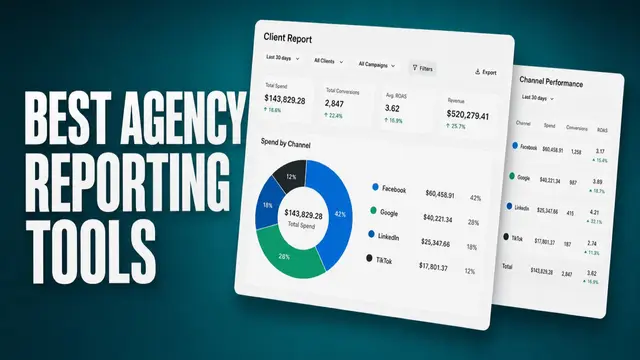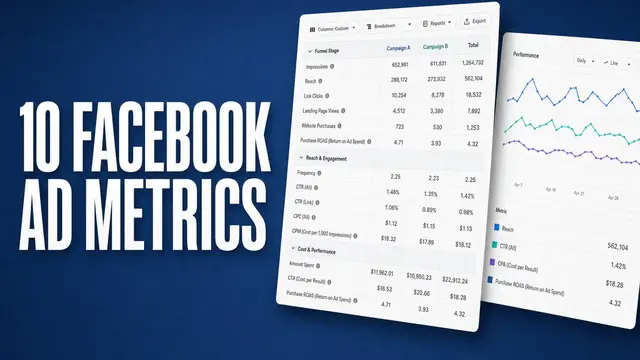

A Facebook Ads reporting tool pulls your campaign data into one dashboard, so you can see what's working without digging through Ads Manager.
I tested dozens of tools by building the same client report in each one. A few couldn't keep up.
These 13 earned a spot, picked for what each does well and who it fits. Below, you can find which one matches your reporting needs.
13 best Facebook Ads reporting tools: TL;DR
- Supermetrics: Best for pulling Meta ad data into Sheets, BigQuery, or your data warehouse.
- AgencyAnalytics: Best for white-label client reporting across every account you manage.
- Triple Whale: Best for ecommerce brands tracking revenue and ROAS in one dashboard.
- Madgicx: Best for AI-driven optimization insights layered on top of your reporting.
- Whatagraph: Best for building polished, branded reports agencies send to clients.
- Meta Ads Manager: Best for free, native reporting straight from your ad account.
- Data Studio: Best for building free, customizable dashboards from any data source.
- Motion: Best for creative-level analytics that show which ad drove results.
- Northbeam: Best for enterprise-grade attribution across your full marketing mix.
- Hyros: Best for tracking true ROAS on high-ticket or long sales cycles.
- DashThis: Best for quick, no-code dashboards without a steep setup.
- Swydo: Best for automated, scheduled reports agencies send on autopilot.
- PorterMetrics: Best for connecting niche marketing data sources into Data Studio.
How I researched and tested these Facebook Ads reporting tools
I connected a live ad account and built the same client report in each tool, so I could compare them side by side.
For tools I couldn't access directly, I worked through demos and documentation, then pulled user feedback from G2 and Capterra to catch anything a sales page glosses over.
Here's what I looked at:
- Meta connection depth: Whether you get standard spend and ROAS numbers only, or can break performance down by ad, placement, and creative.
- Report turnaround: How long it took to go from connecting an account to something I'd trust sending to a client.
- Multi-account handling: How manageable it stays once you're juggling five or ten ad accounts instead of one.
- Customization: Whether you can rebuild a report around the metrics a specific client or team cares about, or you're stuck with a fixed template.
- Price against what you get: Whether the cost tracks with the depth of reporting, or you're paying agency-tier prices for something you could build yourself in Sheets.
A free option like Data Studio covers one account without much trouble. It gets harder to manage once you're building the same report for ten clients every Monday, and that's usually when a paid tool starts to pull its weight.
13 best Facebook Ads reporting tools: quick comparison
| 💻 Tool | 🎯 Best for | 🔥 Starting price (billed annually) | ⚡ Strengths |
|---|---|---|---|
| Supermetrics | Exporting Meta data into Sheets or BigQuery | $44/month | A wide connector library, native BigQuery support, and scheduled data refreshes |
| AgencyAnalytics | Agencies running client dashboards across every account | $20/month | Branded client dashboards, cross-channel reporting, and campaign alerts |
| Triple Whale | Ecommerce brands tracking revenue and ROAS together | $2,190/year | Shopify integration, blended ROAS tracking, and creative-level attribution |
| Madgicx | AI-driven optimization paired with reporting | $32/month | Automated rules, AI budget recommendations, and creative fatigue alerts |
| Whatagraph | Automating recurring client reports for agencies | $812/month | Customizable templates, one-click report sharing, and white label branding |
| Meta Ads Manager | Free native reporting straight from your account | Free | Direct Meta data, real-time campaign updates, and no added cost |
| Data Studio | Free, customizable dashboards from any data source | Free | Flexible visualizations, wide data source support, and no cost to start |
| Motion | Creative-level analytics tied to each ad | $750/month, billed monthly | Visual creative tagging, GA4 integration, and automated leaderboards |
| Northbeam | Enterprise attribution across your full marketing mix | $1,500/month, billed monthly | Cross-channel attribution, incrementality testing, and granular spend data |
| Hyros | Tracking true ROAS on long sales cycles | $69/month, billed monthly | Call tracking, multi-touch attribution, and ad platform sync |
| DashThis | Dashboards live in minutes, no coding required | $44/month | Prebuilt templates, fast setup, and simple client sharing |
| Swydo | Agencies needing budget pacing built into reports | $62/month | Scheduled report delivery, white label options, and budget pacing alerts |
| PorterMetrics | Connecting niche data sources into Data Studio | $12.50/data source/month | Data blending, Google Sheets export, and marketing-specific connectors |
1. Supermetrics: Best for exporting Meta data into Sheets or BigQuery
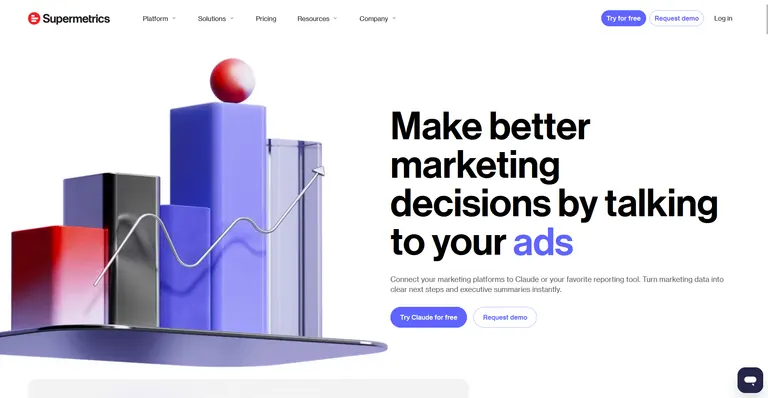
- What it does: Supermetrics pulls ad performance data from Meta and other platforms and sends it to the spreadsheet, dashboard, or warehouse you already use.
- Best for: Marketing teams and agencies that already report out of Google Sheets, Data Studio, or a cloud warehouse and want Meta numbers flowing in on a schedule.
I connected a live Meta ad account to Supermetrics to see how quickly campaign data reaches an actual report.
Within minutes of the first sync, campaign-level fields populated in Google Sheets and kept refreshing on schedule, so my numbers stayed current without manual exports.
Building a blended report across two data sources took longer than expected, since the query builder let me select metrics that don't actually pair together, and the report came back empty before I caught the mismatch.
Key features
- Prebuilt Meta connector: Pulls campaign, ad set, and ad-level fields directly from the Meta Ads API without custom coding.
- Multiple destinations: Sends the same pulled data to Google Sheets, Excel, BigQuery, Snowflake, or another warehouse from one connection.
- Scheduled refreshes: Sets a refresh cadence so new campaign data lands automatically on a set timer.
Pros and cons
| ✅ Pros | ❌ Cons |
|---|---|
| Connects to a wide range of destinations, including Sheets, BigQuery, and Snowflake, from one setup | Native visualization exists now (Supermetrics Dashboards), but it's a newer add-on, so most teams still route data to Sheets or Data Studio for the report itself. |
| Refresh scheduling cuts down on repetitive manual exports for recurring reports | Field names and structures can shift after a platform update, requiring occasional fixes to existing reports |
| Fits directly into an existing reporting setup instead of forcing a new dashboard |
What users say
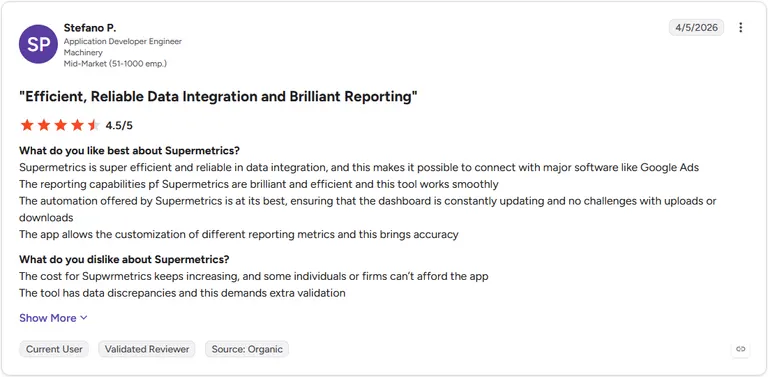
Pro: "Supermetrics is super efficient and reliable in data integration, and this makes it possible to connect with major software like Google Ads. The reporting capabilities of Supermetrics are brilliant and efficient and this tool works smoothly." (Stefano P., G2)
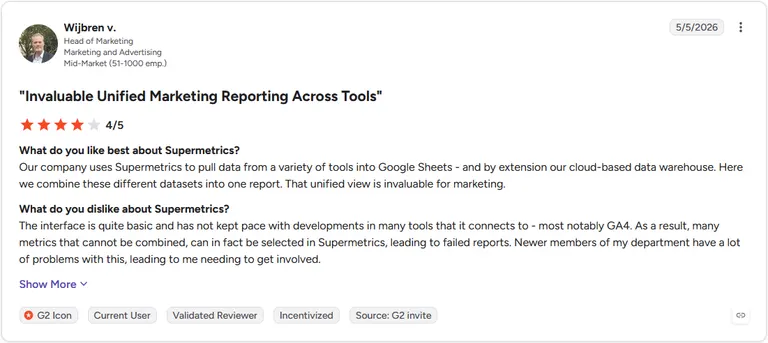
Con: "The interface is quite basic and has not kept pace with developments in many tools that it connects to - most notably GA4. As a result, many metrics that cannot be combined, can in fact be selected in Supermetrics, leading to failed reports." (Wijbren v., G2)
Pricing
Supermetrics starts at $44 per month.
Bottom line
Supermetrics earns its place through breadth of destinations, since the report itself still gets built somewhere else. If you want dashboards built into the platform itself, AgencyAnalytics might be a better fit.
2. AgencyAnalytics: Best for agencies running client dashboards across every account
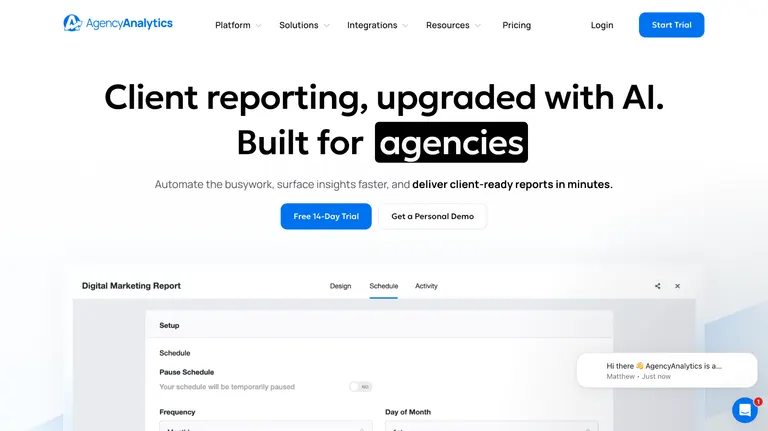
- What it does: AgencyAnalytics connects to dozens of marketing platforms and turns that data into branded dashboards and reports you send straight to clients.
- Best for: Agencies managing several client accounts that want one platform handling both the data connection and the finished report.
To test whether AgencyAnalytics could handle both the data connection and the finished report without a second tool, I built a monthly Meta ad spend report using a live account.
Connecting the account took a few minutes, and once that was done, I had a client logo and custom colors on the report without touching a separate design tool.
Partway through, one of my connections dropped, and I had to manually reconnect it before the numbers updated again.
Key features
- White label dashboards: Applies your agency's logo, colors, and domain to every client-facing report.
- Cross-channel data pulls: Connects to dozens of marketing platforms, including Meta Ads, Google Ads, and SEO tools, in one dashboard.
- Automated alerts: Notifies your team when a client's campaign metrics cross a set threshold.
Pros and cons
| ✅ Pros | ❌ Cons |
|---|---|
| Combines data connection and visualization in one platform, skipping a separate BI tool | Integrations occasionally disconnect and need a manual reconnect before data updates again |
| Branded client dashboards render quickly with a logo and custom domain already applied | Filtering options inside widgets are more basic than a tool like Data Studio, so highly granular breakdowns take extra setup |
| Automated alerts flag performance changes before a client has to ask |
What users say
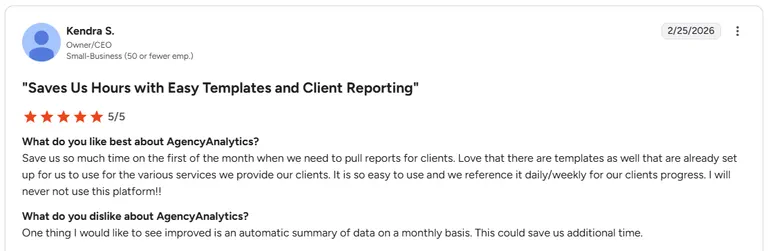
Pro: “Save us so much time on the first of the month when we need to pull reports for clients. Love that there are templates as well that are already set up for us to use for the various services we provide our clients.” (Kendra S., G2)
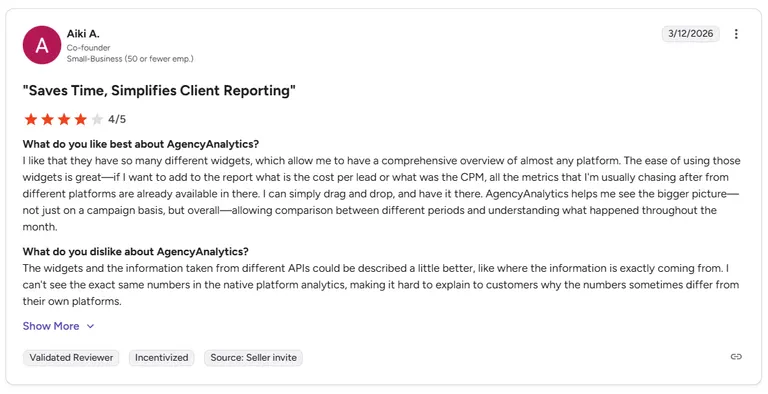
Con: “I can't see the exact same numbers in the native platform analytics, making it hard to explain to customers why the numbers sometimes differ from their own platforms.” (Aiki A., G2)
Pricing
AgencyAnalytics starts at $20 per month.
Bottom line
AgencyAnalytics works because reporting and data connection live in the same platform, so nothing gets rebuilt in a second tool. Supermetrics is worth a look if you'd rather export raw data and build the report yourself.
3. Triple Whale: Best for ecommerce brands tracking revenue and ROAS together

- What it does: Triple Whale connects to your Shopify store and ad accounts, then ties actual revenue back to the specific campaign, ad set, and creative that drove it.
- Best for: Ecommerce brands that want blended ROAS and revenue in one dashboard instead of pulling separate numbers from Shopify and Meta.
I wanted to know if Triple Whale's revenue numbers actually held up against real sales, so I linked a Shopify store and a Meta ad account and let it run for a few days.
Clicking into a single ad creative showed me the exact orders it drove, something Meta's own reporting doesn’t always break down that clearly.
When I pulled a 90-day window to check longer trends, a few widgets took several seconds to load before the numbers caught up.
Key features
- Triple Pixel attribution: Tracks orders back to the ad, ad set, and creative that generated them using first-party tracking.
- Blended ROAS reporting: Combines Shopify revenue with ad spend across Meta, Google, and TikTok in one number.
- Creative-level breakdown: Shows ROAS, hook rate, and cost per purchase for each individual ad creative.
Pros and cons
| ✅ Pros | ❌ Cons |
|---|---|
| Ties revenue directly to Shopify orders, cutting through Meta's own reported ROAS estimates | Dashboards slow down when pulling longer date ranges or larger datasets |
| Creative-level breakdown shows which specific ad drove a sale | Multi-currency and non-USD store setups can produce reporting inaccuracies |
| Native Shopify integration keeps store and ad data in sync without a separate connector |
What users say
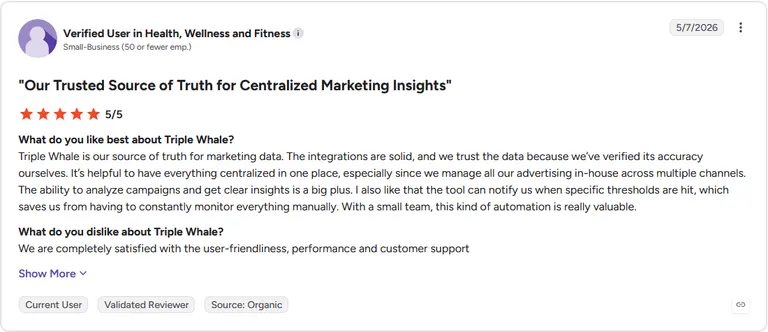
Pro: "Triple Whale is our source of truth for marketing data. ... It's helpful to have everything centralized in one place, especially since we manage all our advertising in-house across multiple channels." (Verified User, G2)
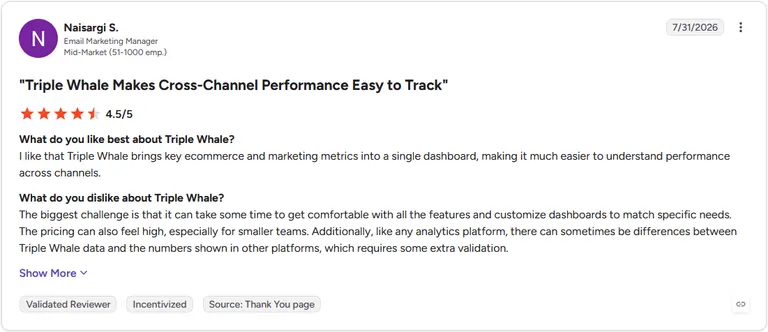
Con: "The biggest challenge is that it can take some time to get comfortable with all the features and customize dashboards to match specific needs. ... like any analytics platform, there can sometimes be differences between Triple Whale data and the numbers shown in other platforms, which requires some extra validation." (Naisargi S., G2)
Pricing
Triple Whale starts at $2,190 per year.
Bottom line
Triple Whale's edge is tying revenue to the exact creative that earned it. If your reporting covers more than ecommerce revenue, AgencyAnalytics might be the better starting point.
4. Madgicx: Best for AI-driven optimization paired with reporting
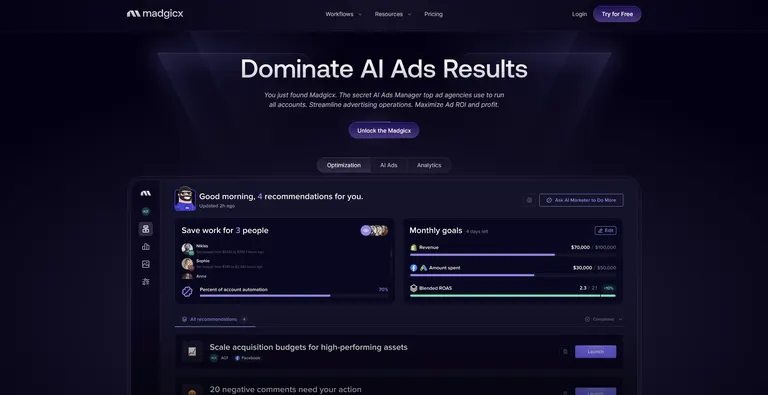
- What it does: Madgicx analyzes your Meta ad account and layers automated rules, budget recommendations, and fatigue alerts on top of standard campaign reporting, one of several AI tools for Facebook Ads optimization built around this kind of automation.
- Best for: Meta advertisers who want AI-driven optimization suggestions built into the same dashboard where they check performance.
I opened a live Meta account in Madgicx to see how well the AI recommendations held up against my own read of the account. The platform flagged a fatiguing creative before its ROAS had visibly dropped in Ads Manager, which gave me a few extra days to prep a replacement.
Getting comfortable with where each feature sat took me longer than expected, since the automation rules, audience tools, and reporting views are spread across several different sections.
Key features
- Creative fatigue alerts: Flags a declining ad before its performance drop becomes obvious in standard reporting.
- AI budget recommendations: Suggests how to shift spend across ad sets based on recent performance.
- Automated rules: Pauses, scales, or adjusts ad sets automatically once a condition you set is met.
Pros and cons
| ✅ Pros | ❌ Cons |
|---|---|
| Fatigue alerts catch declining creatives earlier than a manual check of Ads Manager | Learning curve is steep, since features and settings are spread across several sections |
| Automated rules cut down on manual pausing and scaling decisions | Optimization tools are Meta-only, though reporting spans other channels |
| Useful for agencies managing several client accounts, with white label reporting included |
What users say
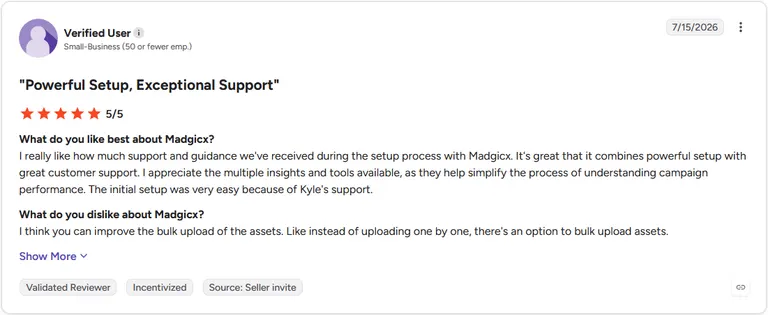
Pro: "I appreciate the multiple insights and tools available, as they help simplify the process of understanding campaign performance." (Verified User, G2)
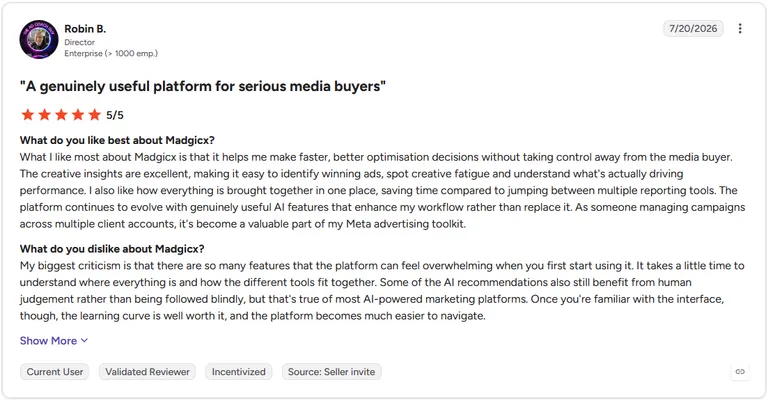
Con: "My biggest criticism is that there are so many features that the platform can feel overwhelming when you first start using it. It takes a little time to understand where everything is and how the different tools fit together." (Robin B., G2)
Pricing
Madgicx starts at $32 per month.
Bottom line
Madgicx pairs reporting with AI recommendations that act on what it finds. Triple Whale might be worth a look if ecommerce revenue matters more to you than Meta-specific optimization.
5. Whatagraph: Best for automating recurring client reports for agencies
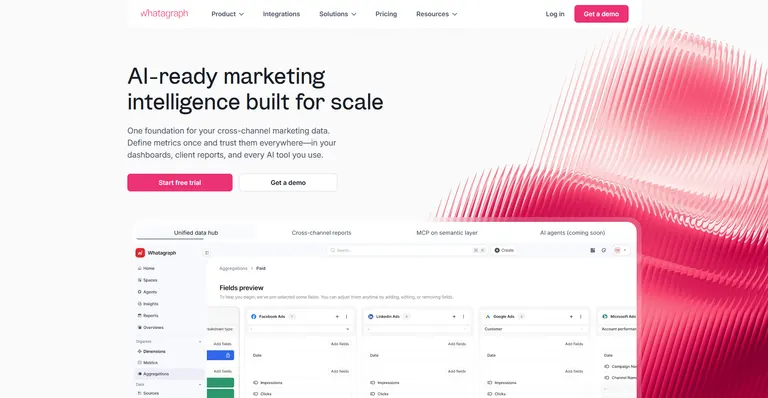
- What it does: Whatagraph pulls data from your connected ad and marketing accounts into a branded report template, then sends it to clients on a set schedule.
- Best for: Agencies that send the same client report every month and want the rebuild and delivery automated.
To see whether Whatagraph could handle the same client report every month without me touching it, I set up a recurring Meta Ads report on a weekly delivery schedule.
The report generated and sent itself on schedule for three straight weeks with the branding and layout staying consistent each time.
One scheduled report went out with a few data points missing, since Whatagraph took about a day to fully sync after one of my connected sources changed, and the report didn't wait for that catch-up before sending.
Key features
- Recurring report scheduling: Builds and sends the same report automatically on a set weekly or monthly cadence.
- White label branding: Applies your agency's logo and colors to every client-facing report.
- Drag and drop report builder: Lets you rearrange widgets and charts without a developer or designer.
Pros and cons
| ✅ Pros | ❌ Cons |
|---|---|
| Scheduled reports go out automatically once set up, cutting recurring manual work | Advanced customization, like complex calculated fields or highly specific chart types, is more limited than a dedicated BI tool |
| Drag and drop builder makes rearranging a report simple without design help | Data source updates can take a day or more to fully reflect after a platform changes its API |
| White label branding keeps every client report consistent without extra setup |
What users say
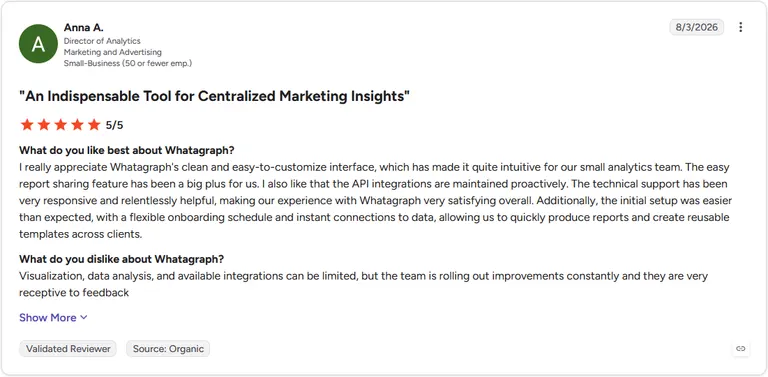
Pro: "I really appreciate Whatagraph's clean and easy-to-customize interface, which has made it quite intuitive for our small analytics team. The easy report sharing feature has been a big plus for us." (Anna A., G2)
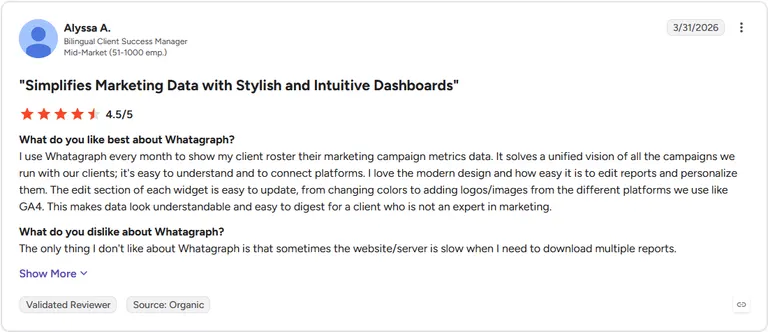
Con: "The only thing I don't like about Whatagraph is that sometimes the website/server is slow when I need to download multiple reports." (Alyssa A., G2)
Pricing
Whatagraph starts at $812 per month.
Bottom line
Whatagraph's strength is the recurring send, since it removes the monthly rebuild entirely. Madgicx could be the better fit if optimization matters more to you than client-facing report delivery.
Special mentions
Eight more names came up constantly while I worked through this list, and each one earned its spot for a specific job even though none of them cracked the top 5.
Here are 8 more Facebook Ads reporting tools worth considering:
6. Meta Ads Manager
Meta Ads Manager is Meta's own reporting and campaign tool, built directly into your ad account at no extra cost.
I pulled a week of ad set data straight from it and checked the numbers against a third-party export. The two matched down to the dollar, which settled a question I'd had about how much accuracy gets lost going straight to the source.
Managing more than one client account meant switching between separate views, since Ads Manager doesn't combine performance data across accounts into one unified report.
7. Data Studio
Data Studio is Google's free dashboard builder, connecting to Meta and dozens of other data sources.
I started a report from a blank canvas to see how far the free tier could stretch. It handled a full month of campaign data without ever asking for a subscription upgrade, and the connector list covered every source I needed.
Google's official templates lean toward its own products, so there's no built-in Meta Ads template. Anything Meta-specific means grabbing a third-party template or building the layout yourself. We set out what belongs in one in Facebook Ads report template.
8. Motion
Motion is a creative analytics platform with its deepest integration on Meta, plus support for TikTok, YouTube, and LinkedIn. It groups your creatives by hook, format, and performance instead of listing ads by ID number.
I connected an account running a modest monthly spend, and the groupings stayed genuinely useful even with a shorter ad history than Motion typically works best with.
An account with only a handful of live creatives produced groupings too thin to spot a real pattern, so the tool needs some ad volume behind it to earn its keep.
💡Tip: If you're weighing automation tools against pure analytics platforms, check out our guide on AI tools for Facebook Ads automation.
9. Northbeam
Northbeam is an attribution platform for ecommerce brands. It models performance across your full marketing mix instead of leaning on last-click data from one platform.
Running it against a Meta-heavy account surfaced a channel that appeared to be driving more revenue than its own platform reporting showed, which reframed how I'd have allocated budget that month.
Tracing exactly why the model credited one channel over another wasn't always clear, since some of its logic stayed opaque even after digging into the settings.
10. Hyros
Hyros is an ad tracking and attribution tool, tracking calls, emails, and ad clicks together to trace a sale back to its original source.
I ran it against a multi-step sales process, and it caught conversions that happened days after the initial ad click, something standard Meta reporting missed.
A conversion tracked through both a phone call and an ad click showed up counted in 2 places until I adjusted the attribution settings, so the overlap needs manual cleanup to avoid double counting.
11. DashThis
DashThis is a dashboard reporting tool that lets you build a client dashboard out of preset widgets you drag into place.
Connecting a Meta account and sharing a live link with a client took under an hour, no login required on their end.
Reshaping a widget outside its preset layout wasn't an option, so a couple of specific client requests had to go unanswered.
12. Swydo
Swydo is an agency reporting platform. It lets you automate recurring client reports and send an alert if a connected data source drops.
A source disconnected partway through testing, and Swydo flagged it before the next report went out with missing numbers, catching something I would have otherwise sent to a client by mistake.
A metric I needed from a smaller platform wasn't natively supported, so getting it in meant a manual Google Sheets workaround.
13. PorterMetrics
PorterMetrics is a data connector that links niche marketing data sources into Data Studio and Google Sheets.
I used it to pull in a source Data Studio doesn't support on its own, and the blended data landed in one Sheet without extra formatting on my end.
Its connector library covers around 20 marketing-specific sources, so an unusual platform outside that list may not be covered at all.
Which Facebook Ads reporting tool should you choose?
The right pick depends on whether you already have a place to send your data, how many clients or accounts you're reporting on, and how much of the process you want automated versus built by hand.
Choose Supermetrics if you:
- Already report out of Google Sheets, Data Studio, or a cloud warehouse and want Meta data flowing in on schedule
- Need to send the same data to multiple destinations, like BigQuery or Snowflake, from one connection
- Don't mind building the report yourself once the data lands
Choose AgencyAnalytics if you:
- Run an agency managing dashboards across several client accounts
- Want data connection and the finished report living in the same platform
- Need white label branding on every client-facing report without a separate design step
Choose Triple Whale if you:
- Sell on Shopify and want revenue tied directly to the ad, ad set, or creative that drove it
- Need blended ROAS that combines store revenue with spend across Meta, Google, and TikTok
- Care about creative-level attribution in addition to campaign-level numbers
Choose Madgicx if you:
- Run ads primarily on Meta and want AI-driven budget and creative recommendations
- Want automated rules acting on your account alongside the reporting itself
- Are managing enough ad volume for the AI recommendations to have real data to work from
Choose Whatagraph if you:
- Send the same client report on a recurring schedule and want it automated
- Want white label branding applied consistently without touching it each time
- Prefer a drag-and-drop builder over configuring a report from scratch
Skip a reporting tool entirely if:
- You're managing a single small account, and Meta Ads Manager already answers your questions
- Your ad spend is low enough that manual checks take less time than setting up and maintaining a new tool
- You need creative-level insight and workflow, as well as reporting, in which case a platform like Atria fits that gap better
Get more than a number from your Facebook Ads reporting tool
A Facebook Ads reporting tool can tell you a campaign's ROAS dropped. A few, like Madgicx, will even suggest what to adjust. Fewer still connect that fix to a new creative built from your own account's data and a competitor's proven angle, which is the specific gap Atria is built to close.
Atria sits in a different category from the reporting tools above. As a creative intelligence platform, it's built for creative reporting. It ties your numbers to the specific ad, hook, or angle behind them, instead of just showing you a metric moved.
Here's what that looks like in practice:
- Ad grading: Every ad you run gets scored in plain English, with a specific fix attached to whatever's holding it back, so a dip in your numbers comes with an answer instead of a guess.
- Creative performance tracking: Radar keeps watch on your ads and flags one starting to fatigue, often before the decline shows up in your weekly report.
- Competitor research: Raya follows a competitor and pulls their strongest hooks and angles from a database of over 100 million ads, so your next brief starts from something proven.
- Creative generation: Turn a winning angle into a new concept built from your own account's performance data, not a generic template.
Curious what Atria would catch in your account? Try Atria for free today.
Frequently asked questions
How do you choose the best Facebook Ads reporting tool for your business?
The best Facebook Ads reporting tool is Supermetrics if you already have a dashboard or warehouse to send data to, or AgencyAnalytics and Whatagraph if you want the report finished and branded automatically.
What metrics should a Facebook Ads reporting dashboard include?
A Facebook Ads reporting dashboard should include spend, ROAS, CPA, CTR, and conversions broken down by campaign and ad set.
Creative-level metrics, like which specific ad or hook drove a result, add more useful detail than campaign totals alone. Agencies typically add a client-facing metric, like cost per lead, based on what that account is optimizing toward.
Is Meta Ads Manager enough for Facebook Ads reporting?
Yes, Meta Ads Manager is enough for Facebook Ads reporting if you manage a single account and only need Meta's own numbers.
It falls short once you manage multiple accounts, blend Meta data with Shopify or Google Ads, or need a branded report to send a client. A dedicated reporting tool fills that gap by pulling every source into one place automatically.