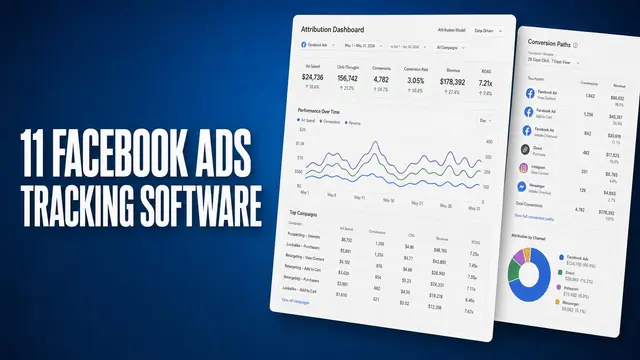

A Facebook Ads report template gives you a repeatable structure for tracking performance, so you don't have to rebuild a dashboard every week.
Most templates I've reviewed stop at listing metrics like click-through rate and cost per click, and skip what actually matters to a client or exec: what to do with that number.
Here's what a report needs to hold up under scrutiny, plus how to build your own.
What is a Facebook Ads report template?
A Facebook Ads report template is a reusable structure for organizing ad performance data into a format you can update on a recurring basis. It sets the sections, metrics, and layout once, so each new reporting period fills in with fresh numbers instead of starting from a blank page.
That structure can take 2 forms:
- A downloadable file: Something like a Google Sheets or Data Studio template that connects directly to your ad account and pulls data automatically.
- A framework you build yourself: A set of sections and metrics you commit to including every time, regardless of the tool.
Knowing what belongs in a report and why matters more than any specific file, since it works in whatever reporting tool you're already using. I'd rather teach someone to build a report from scratch than hand them a dashboard they don't understand.
Facebook Ads report structure: what to include
A report for a client or exec needs different information than one built for the person running campaigns day to day. Build yours with these components:
For client and executive reports
Keep these focused on outcomes. The goal is to show impact in a way that’s quick and easy to understand:
| Order | Section | What it covers | Format | Cadence |
|---|---|---|---|---|
| 1 | Bottom-line impact | ROI (return on investment) and ROAS (return on ad spend) by campaign, the numbers they're judging you on | Slide or one-pager | Monthly or quarterly |
| 2 | CPA trend | Cost per acquisition over time, since one good week can hide a bad month | Slide or one-pager | Monthly |
| 3 | Summary | 1-2 sentences explaining what the numbers mean | Slide or one-pager | Monthly or quarterly |
| 4 | Wins and risks | What worked, what didn't, and what changes next | Slide or one-pager | Monthly or quarterly |
For operational and internal reports
Because operational reports are built for the person making daily decisions inside the ad account, they often need more detail:
| Order | Section | What it covers | Format | Cadence |
|---|---|---|---|---|
| 1 | Creative performance | Which ads are winning and which are losing steam | Dashboard or spreadsheet | Weekly |
| 2 | Budget pacing | Daily and weekly spend against target | Dashboard or spreadsheet | Daily or weekly |
| 3 | Audience and placement | Where budget is working best, by age, region, or placement | Dashboard or spreadsheet | Weekly |
| 4 | Funnel metrics | Click-through rate, add-to-cart rate, and conversion rate together | Dashboard or spreadsheet | Weekly |
💡 Tip: To save time, you can use AI tools to pull and organize this data automatically, so you aren’t exporting it by hand every week.
How to build your own Facebook Ads report template
Building a template is easier to explain with one account in mind than with abstract advice. Here's the process, walked through using a single example the whole way, so you can swap in your own numbers once you see how the pieces fit:
1. Choose your tool
Say you're an agency building a monthly reporting template for a client spending around $30,000 a month on Meta.
Meta's native reporting tool works if you're managing one account like this, since it lets you start from a built-in template or build a report from scratch, then save your version to reuse.
Building from scratch takes more time upfront, but every section ends up there for a reason you chose.
I’d switch to a business intelligence tool like Data Studio once you're managing more than one client. That way, you can build the report layout, charts, and branding once, then connect each new account's data. The same shell works for client 2 and client 3 without you rebuilding anything.
2. Set your sections and order
Lead with what the client cares about most, then work backward to the detail.
For the client-facing version, you want bottom-line impact, spend efficiency, a summary, then wins and risks last, since that's the part someone acts on after reading everything else.
The internal version flips that logic. Creative performance goes first, since a fatigued ad affects everything downstream. Budget pacing and audience breakdowns come next, then funnel metrics last, since that's where a problem from an earlier stage actually shows up.
3. Decide what updates automatically
Connect your ad account so metrics like spend, ROAS, and CPA refresh on their own. Leave the summary and wins-and-risks sections open, since those need someone to interpret the numbers each month.
Common mistakes in Facebook Ads reporting
I've reviewed a lot of reports that look sharp and still fail to tell anyone anything useful. The mistakes tend to repeat themselves across accounts, and most of them are easy to fix once you know what to look for:
- Reporting on vanity metrics: Impressions and reach look good in a slide but don't tell a client anything about ROI. Fix it by tying every metric back to a dollar outcome, or cutting it from the report.
- Skipping creative analysis: A report that only shows spend and conversions misses why performance shifted in the first place. I'd add a line explaining which creative drove the change instead of only noting that one occurred.
- Mismatched cadence: A monthly-only report catches a fatigued ad weeks after the budget's already been wasted on it. Match the cadence to who's reading it, weekly for the person managing the account, monthly for the client who just needs the outcome.
- Skipping ad optimization between cycles: Treating the report as the only checkpoint means underperforming ads may run longer than they should. I recommend building in a mid-cycle check to catch a bad ad before the next report surfaces it as a problem.
Get more than numbers from your Facebook Ads report
A Facebook Ads report template rarely tells you what action to take next. Most reporting tools stop at the number, a dropped ROAS or a rising CPA, and leave the next move up to you. Atria approaches this differently.
Atria is a creative intelligence platform built around creative reporting, connecting the number in your report back to the exact ad, hook, or angle that caused it.
Here's what that looks like inside your workflow:
- Plain-English ad grading: Radar, Atria's grading and monitoring feature, grades every ad with a specific reason behind the score, so a weak number in your report comes with context.
- Fatigue alerts before your next report: Radar tracks creative performance in real time and flags a declining ad early, often before it ever shows up as a dip in your next reporting cycle.
- A massive ad research library: Pull hooks and angles from competitors you follow, so the section on "what changes next" starts from something already proven.
- Data-backed creative generation: Build a new ad concept directly from your own account's performance history.
Want to see what your next report could actually recommend? Try Atria for free.
Frequently asked questions
What should a Facebook Ads report include?
A Facebook Ads report should include return on investment (ROI), return on ad spend (ROAS), cost per acquisition (CPA), and a summary explaining what the numbers mean.
Client-facing reports need a short narrative and next steps. Internal reports need more detail, like creative performance, budget pacing, and funnel metrics, since the person reading it acts on it daily.
How often should you send a Facebook Ads report to clients?
Many agencies send client-facing Facebook Ads reports monthly or quarterly. Internal, operational reports need a weekly or daily cadence instead, since spend and creative performance can shift fast enough to require action before the next client report is due.
What's the difference between a Facebook Ads report and a dashboard?
The main difference between a Facebook Ads report and a dashboard is that a Facebook Ads report is a static summary built for a specific period, while a dashboard updates continuously with live data.
Reports work well for client updates and monthly reviews. Dashboards work better for daily monitoring, since they surface a problem as it happens instead of after a cycle ends.
Can you automate a Facebook Ads report?
Yes, you can automate a Facebook Ads report using tools like Data Studio or Google Sheets connected to your ad account. Metrics like spend, ROAS, and CPA update automatically.
Sections like summaries and recommendations still need a person to write them, though tools like Atria's Radar can automate parts of that interpretation by grading ads and flagging issues in plain English.
Does Facebook have a built-in reporting tool?
Yes, Facebook's Ads Reporting tool lets you build and save custom reports directly inside Ads Manager. You can choose a built-in template or start from scratch, then customize the metrics and breakdowns before saving it to reuse for future reporting periods.