
Client reports pile up fast when you're managing several ad accounts, and building them by hand each month eats into time better spent on strategy. Agency reporting tools automate those updates and can cut hours of manual work.
I built sample dashboards and connected mock ad accounts across more than a dozen platforms to see which ones actually reduced that workload.
These are the 12 that held up for agency workflows in 2026, along with where each one fits your client mix.
12 best agency reporting tools: TL;DR
- DashThis: Best for agencies that want automated, repeatable dashboards across many clients.
- AgencyAnalytics: Best for agencies that need a white label, client-facing portal.
- Klipfolio: Best for teams that want full control over custom metrics and formulas.
- Databox: Best for teams that need to track performance against specific goals.
- Atria: Best for agencies that need creative-level performance reporting on Meta.
- ReportGarden: Best for agencies running paid media campaigns that need budget tracking.
- Two Minute Reports: Best for teams that already build reports in Google Sheets or Data Studio.
- Cyfe: Best for teams that want marketing, sales, and support metrics on one dashboard.
- Improvado: Best for larger teams centralizing data from many sources into one warehouse.
- Supermetrics: Best for teams that need a reliable data connector rather than a full dashboard.
- Whatagraph: Best for agencies that want polished, visual client-facing reports.
- Signara: Best for teams that want written narrative summaries alongside standard dashboards.
How I researched and tested these agency reporting tools
I tested everything from connecting a single ad account to building a full client-ready dashboard from scratch. For tools that required a sales call before granting access, I relied on product demos and documentation to confirm how the core reporting workflow holds up.
Here's what I considered:
- Reporting accuracy: How closely each dashboard pulled and matched the source platform data without manual corrections.
- Setup speed: How long it took to connect an ad account and get a usable report or dashboard running.
- Integration depth: Whether the tool connects to the ad platforms and other software agencies already use, like Meta, Google Ads, and project management tools.
- Client-readiness: How much a report can be branded, customized, and shared directly with a client without extra formatting work.
- Value for the price: Whether the features included at each pricing tier match what a small or mid-sized agency actually needs.
Testing across these criteria showed a clear split between tools built for agencies managing many clients at once and tools better suited to a single in-house marketing team.
12 best agency reporting tools: quick comparison
| Tool | Best for | Starting price (billed annually) | Strengths |
|---|---|---|---|
| DashThis | Automated multi-client dashboard reporting | $44/month | Fast setup, wide integration list, and white label branding |
| AgencyAnalytics | White label client reporting | $20/client/month | Client-facing dashboards, campaign goal tracking, and agency-specific templates |
| Klipfolio | Custom dashboard building | $120/month | Deep customization, formula-based metrics, and flexible data blending |
| Databox | KPI monitoring and goal tracking | $64/month | Mobile alerts, goal pacing views, and a large template gallery |
| Atria | Meta creative performance reporting | $129/month | Ad-level grading, competitor creative tracking, and hook and angle breakdowns |
| ReportGarden | PPC-focused agencies | $75/month | Budget pacing tools, proposal generation, and ad spend tracking |
| Two Minute Reports | Fast setup in Google Sheets and Data Studio | $81/month | Quick native integration, low learning curve, and flexible spreadsheet output |
| Cyfe | Budget-friendly all-in-one dashboards | $29/month, billed monthly | Low starting cost, wide widget library, and historical data storage |
| Improvado | Enterprise-scale data aggregation | Custom pricing | Deep ETL pipelines, large connector catalog, and custom data warehousing |
| Supermetrics | Data connector variety | ~$44/month (€39) | Broad platform coverage, spreadsheet-native workflow, and BI tool compatibility |
| Whatagraph | Visual client-facing reports | $812/month | Clean report design, automated scheduling, and cross-channel summaries |
| Signara | AI-generated report narratives | $29/month, billed monthly | Written performance summaries, deterministic KPI calculations, and natural language dashboard queries |
1. DashThis: Best for automated multi-client dashboard reporting
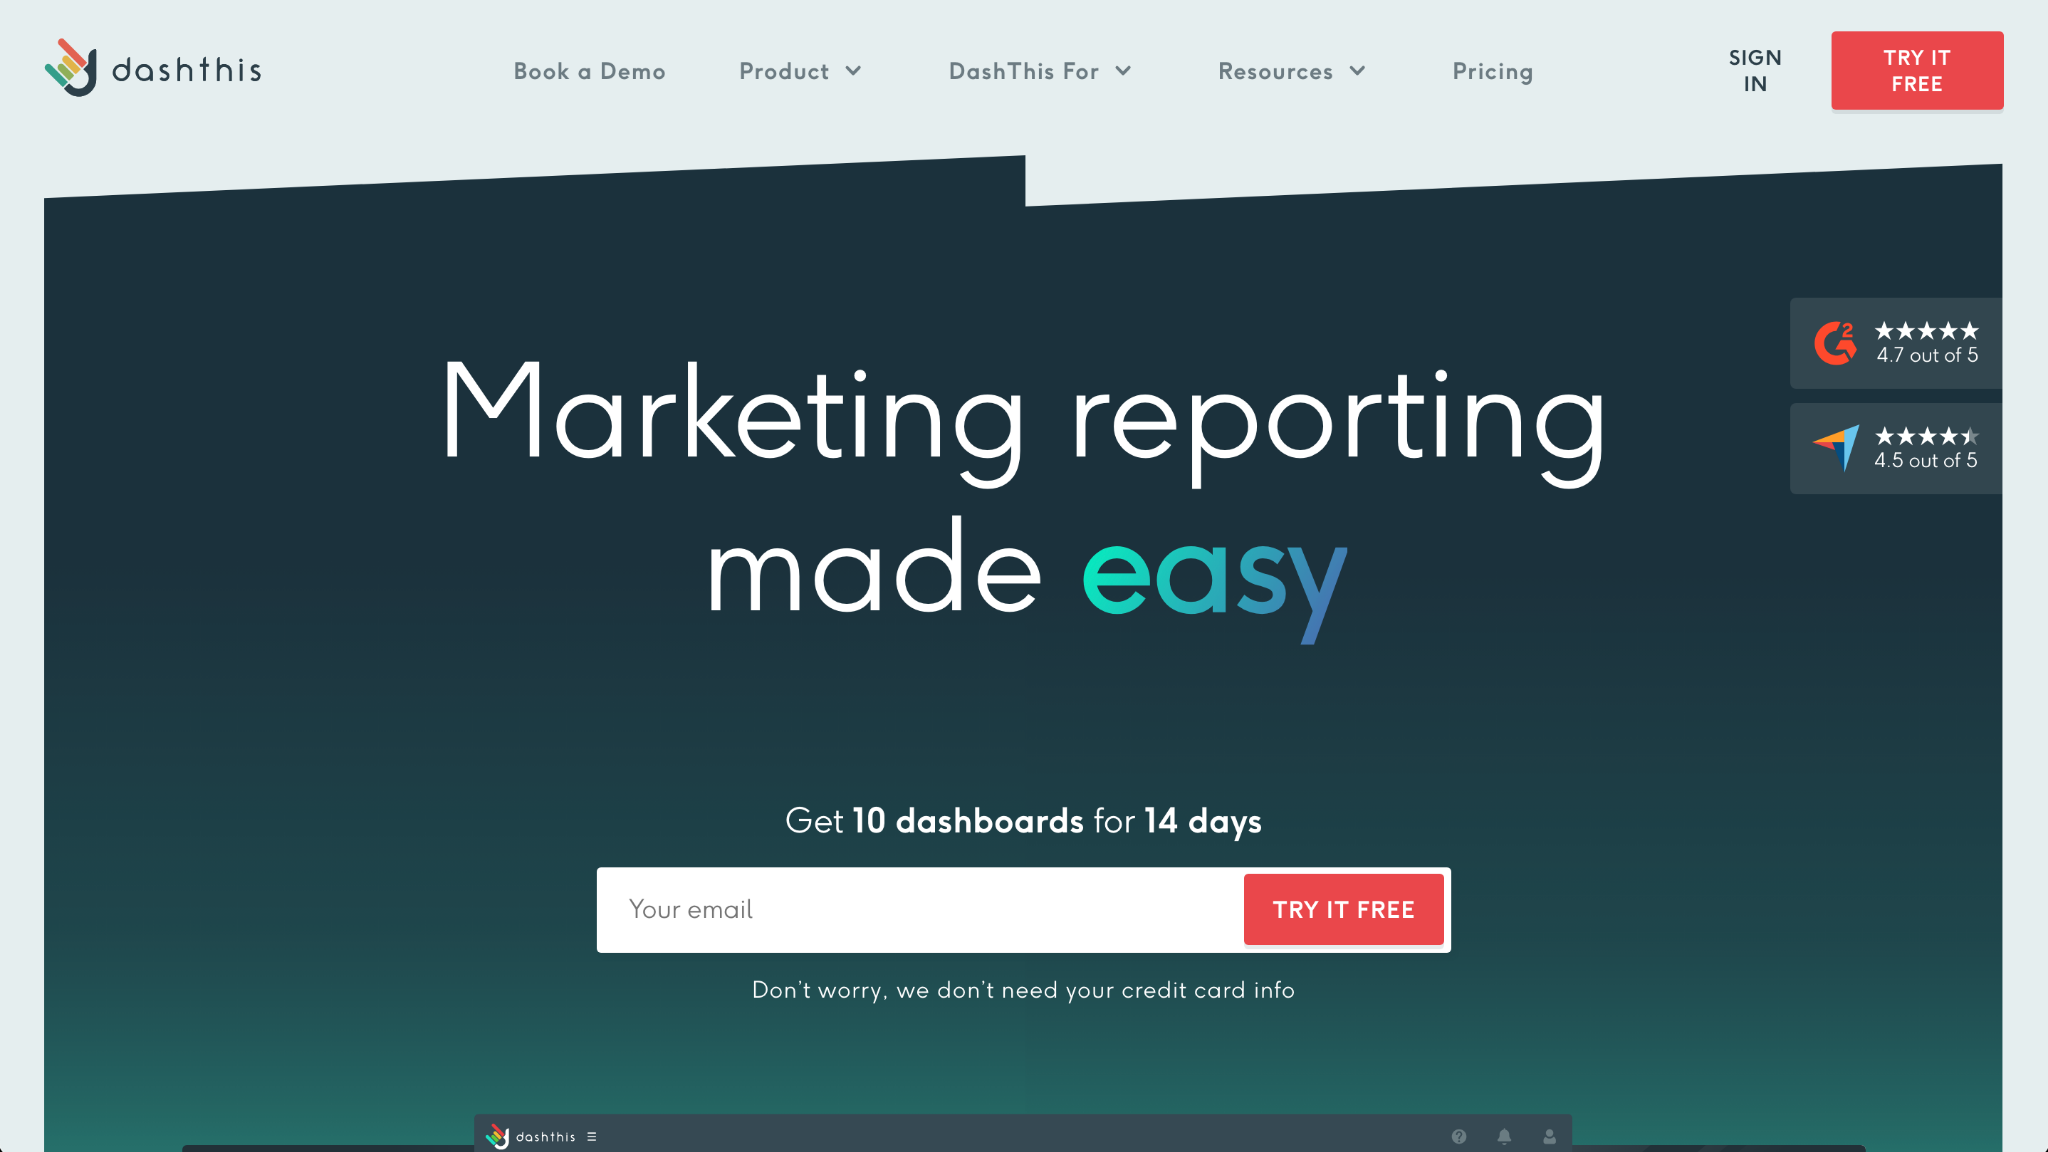
- What it does: DashThis pulls marketing data from connected ad accounts and platforms into automated, pre-formatted dashboards built for client reporting.
- Best for: Agencies managing several client accounts that want repeatable dashboards without building each one from scratch.
I built a sample dashboard in DashThis by connecting a mock ad account to see how much setup the automation saves.
Preset templates auto-populate with metrics and widgets within a few minutes. Adjusting an existing layout was slower, since moving a widget meant repositioning it individually.
Key features
- Calculated widgets: Build custom metrics by combining data from multiple connected integrations into one number.
- Preset templates: Choose from dozens of pre-built dashboard layouts covering common reporting needs like PPC, SEO, and social media.
- AI insights: Get automated summaries covering wins, issues, and opportunities based on the connected data in each dashboard.
Pros and cons
| Pros | Cons |
|---|---|
| Unlimited users, integrations, and data sources included on every plan | Moving widgets between dashboard sections requires repositioning each one individually |
| White label branding available starting on the Professional plan | The number of reporting metrics available for some integrations feels limited compared to platform-native reports |
| Automated email delivery keeps client reports running on a set schedule |
What users say
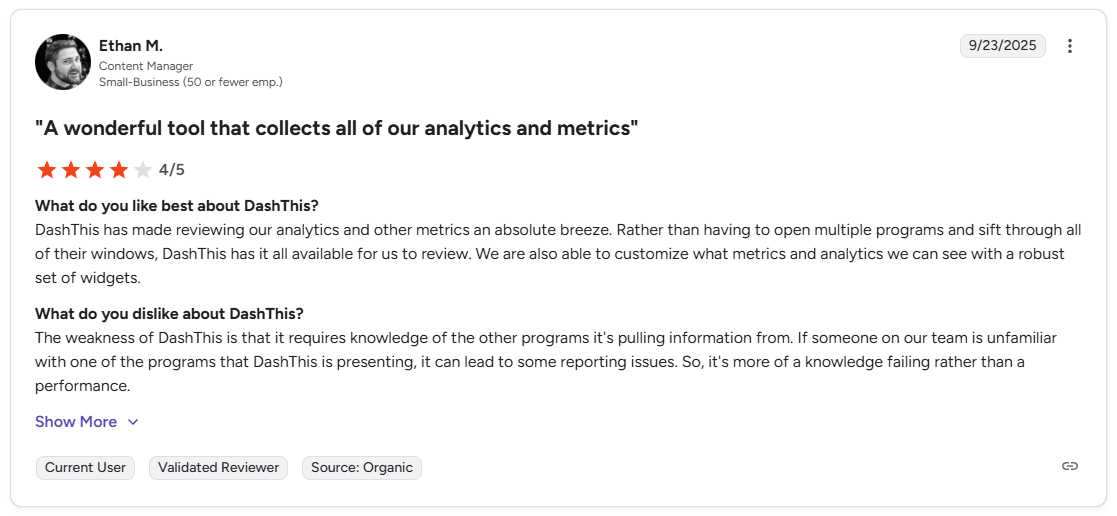
Pro: "DashThis has made reviewing our analytics and other metrics an absolute breeze. Rather than having to open multiple programs and sift through all of their windows, DashThis has it all available for us to review. We are also able to customize what metrics and analytics we can see with a robust set of widgets." - Ethan M., G2
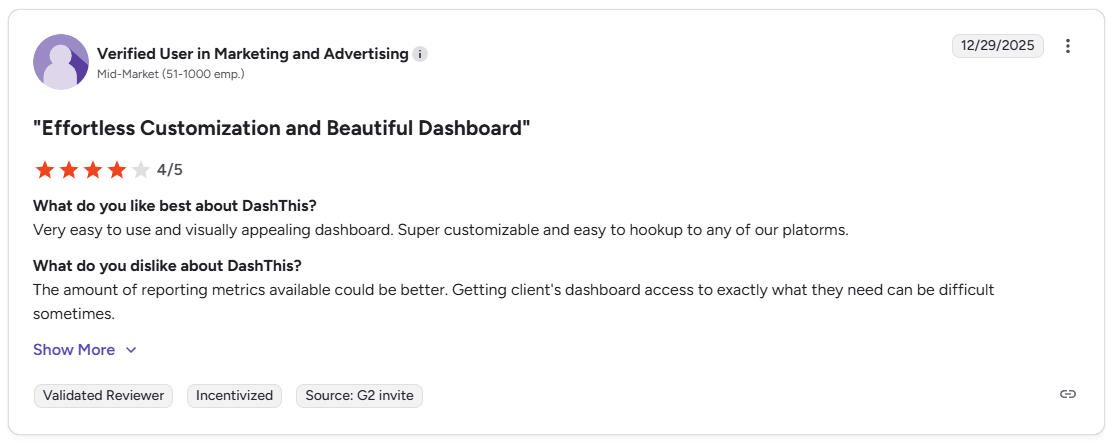
Con: "The amount of reporting metrics available could be better. Getting [clients'] dashboard access to exactly what they need can be difficult sometimes." - Verified User, G2
Pricing
DashThis starts at $44 per month, which includes 3 dashboards and 15 data sources.
Bottom line
DashThis charges by dashboard and source count instead of by user or client, so pricing scales with reporting volume instead of team size. If you need deeper customization over how metrics get calculated and displayed, Klipfolio might be a better fit.
2. AgencyAnalytics: Best for white label client reporting
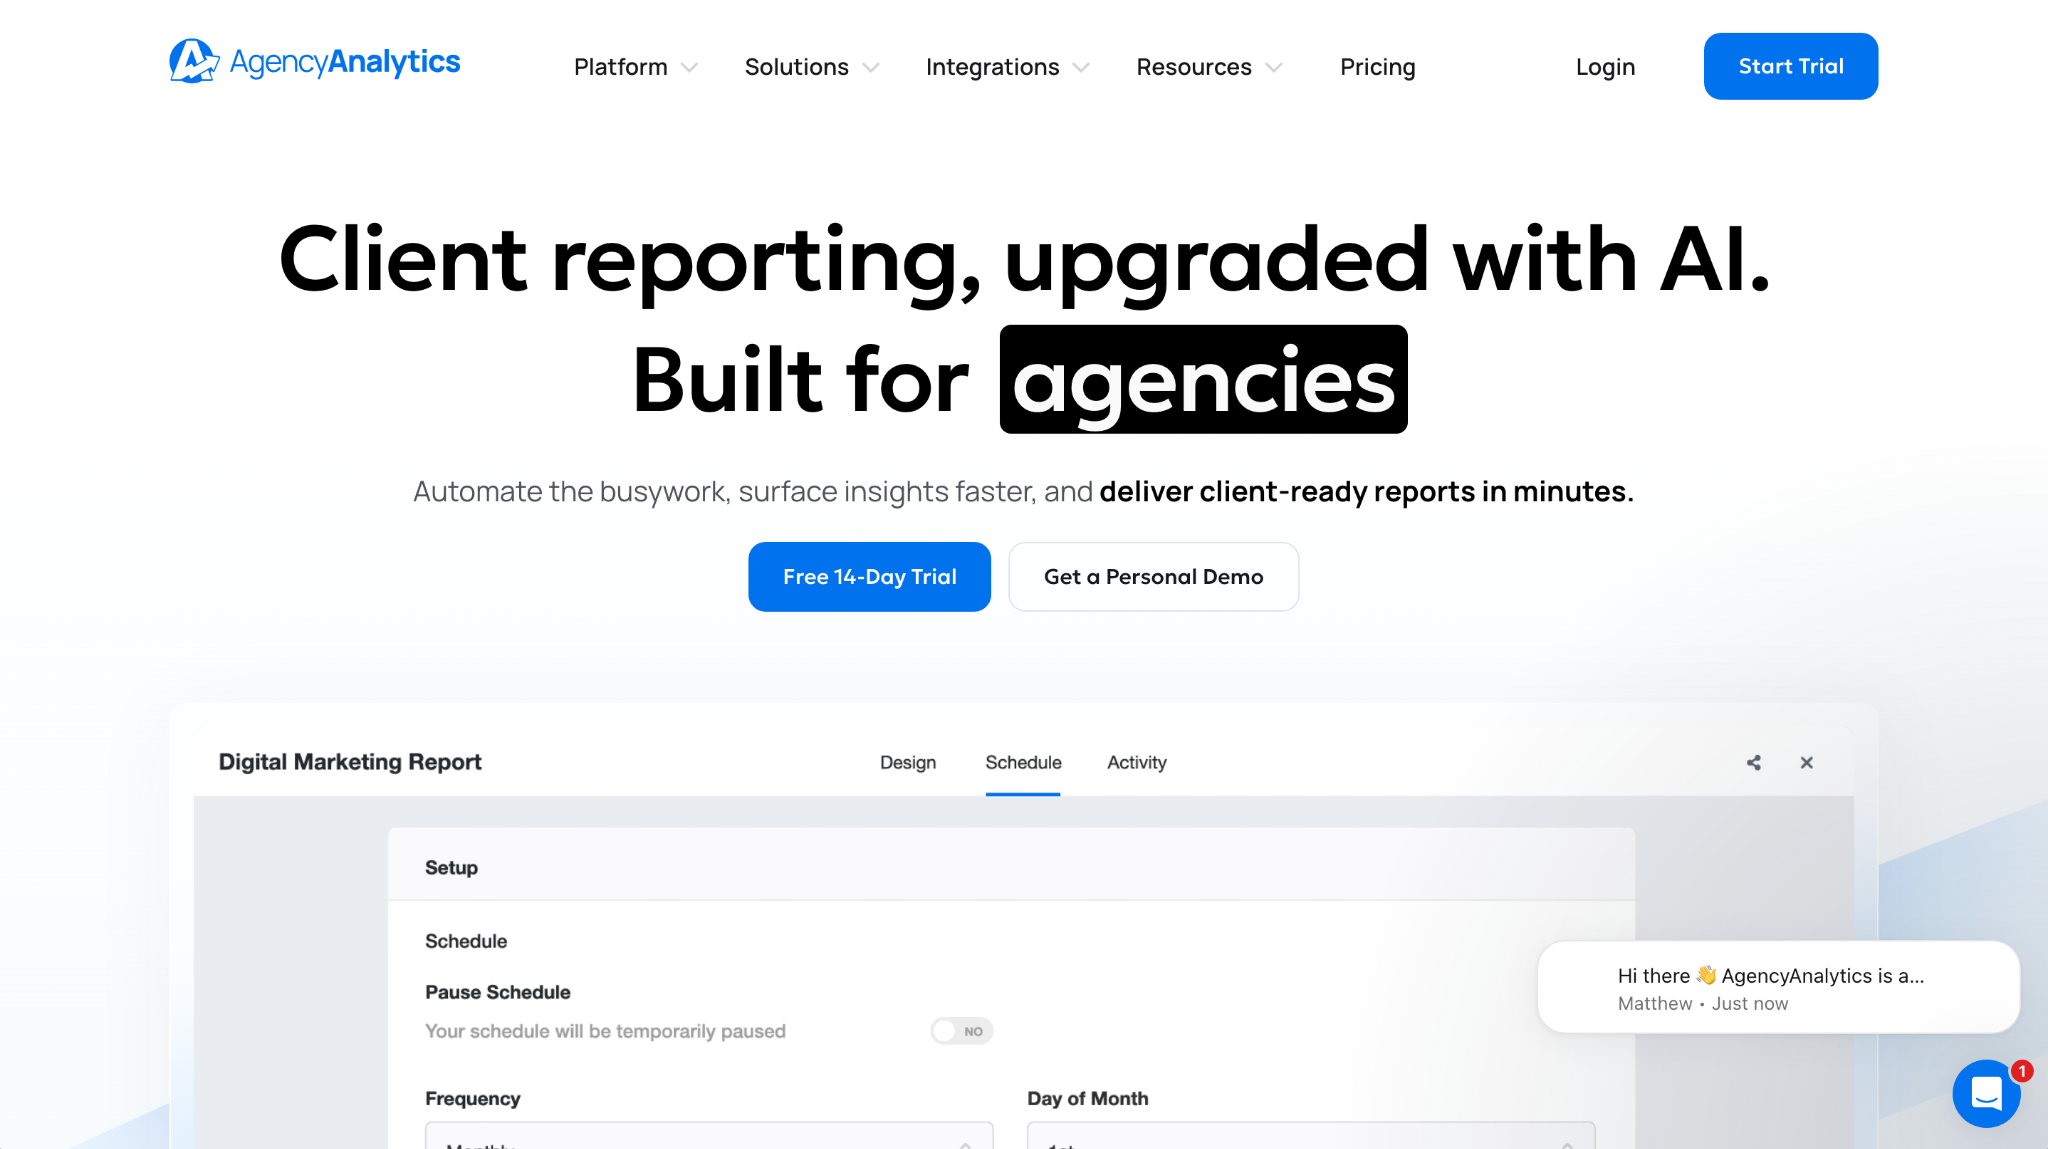
- What it does: AgencyAnalytics automates client reporting across connected ad and marketing accounts, then delivers dashboards under an agency's own branding.
- Best for: Agencies that need a client-facing portal and reports that carry their own brand instead of the software's.
One of the reasons teams choose AgencyAnalytics is its white label branding, so I tested it with a custom logo, color scheme, and domain.
The client-facing dashboard came back with no visible AgencyAnalytics branding once everything was set. However, the Smart Reports summary needed a few edits before the wording matched how I'd normally write a client update.
Key features
- Smart Reports: Auto-generate narrative summaries of campaign performance based on connected client data.
- Client access portal: Give clients a branded login where they can view their own reports and dashboards.
- Goal tracking and alerts: Set performance targets per client and get notified when a metric moves outside a set range.
Pros and cons
| Pros | Cons |
|---|---|
| Custom domain and full white label branding included on every plan | Smart Reports summaries needed manual editing to sound less generic |
| Unlimited staff and client users regardless of plan size | Connecting some integrations for multiple accounts per client is limited to certain platforms |
| Built-in benchmarks and anomaly detection flag unusual performance shifts automatically |
What users say
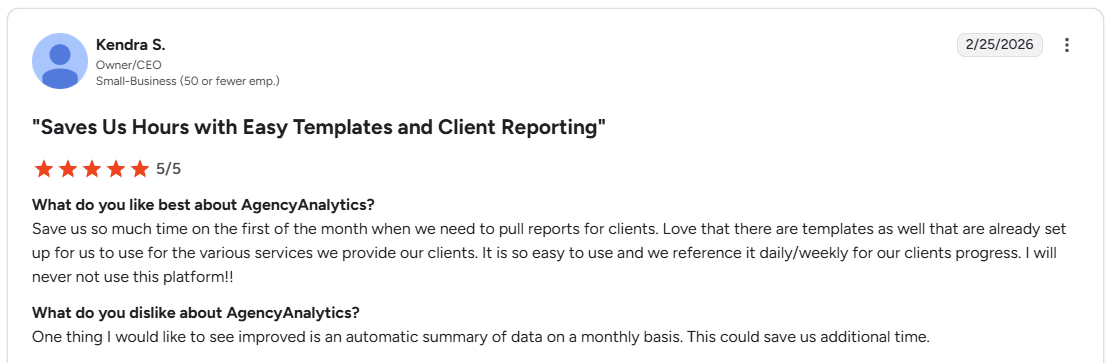
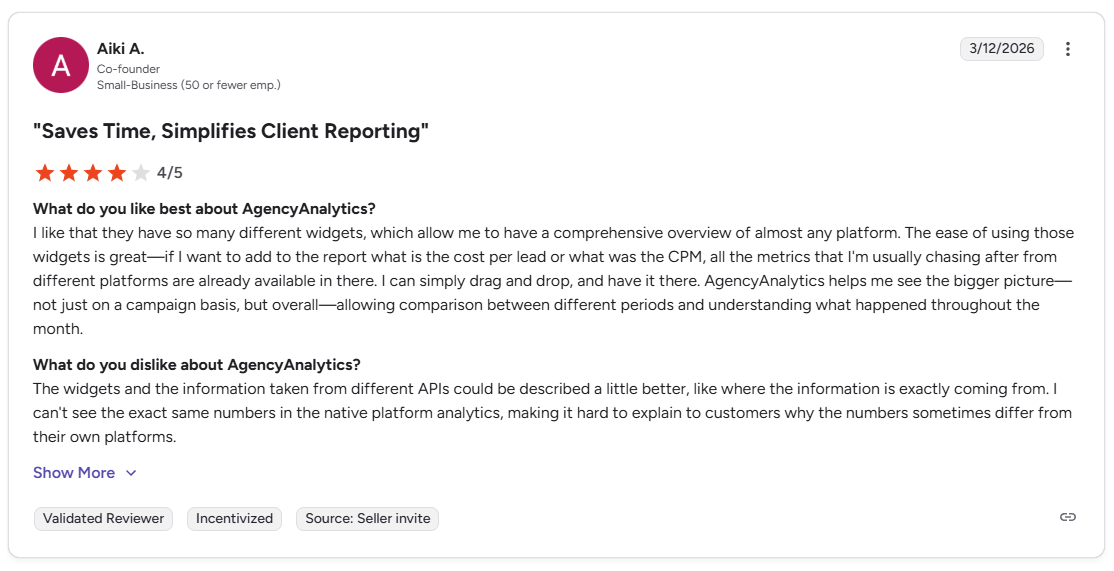
Pro: "Save us so much time on the first of the month when we need to pull reports for clients. Love that there are templates as well that are already set up for us to use for the various services we provide our clients." - Kendra S., G2
Con: "I can't see the exact same numbers in the native platform analytics, making it hard to explain to customers why the numbers sometimes differ from their own platforms." - Aiki A., G2
Pricing
AgencyAnalytics starts at $20 per client per month.
Bottom line
AgencyAnalytics prices per client, so cost scales directly with how many accounts you manage. If your reporting needs are lighter and pricing per dashboard fits your workflow better, DashThis might be the better choice.
3. Klipfolio: Best for custom dashboard building
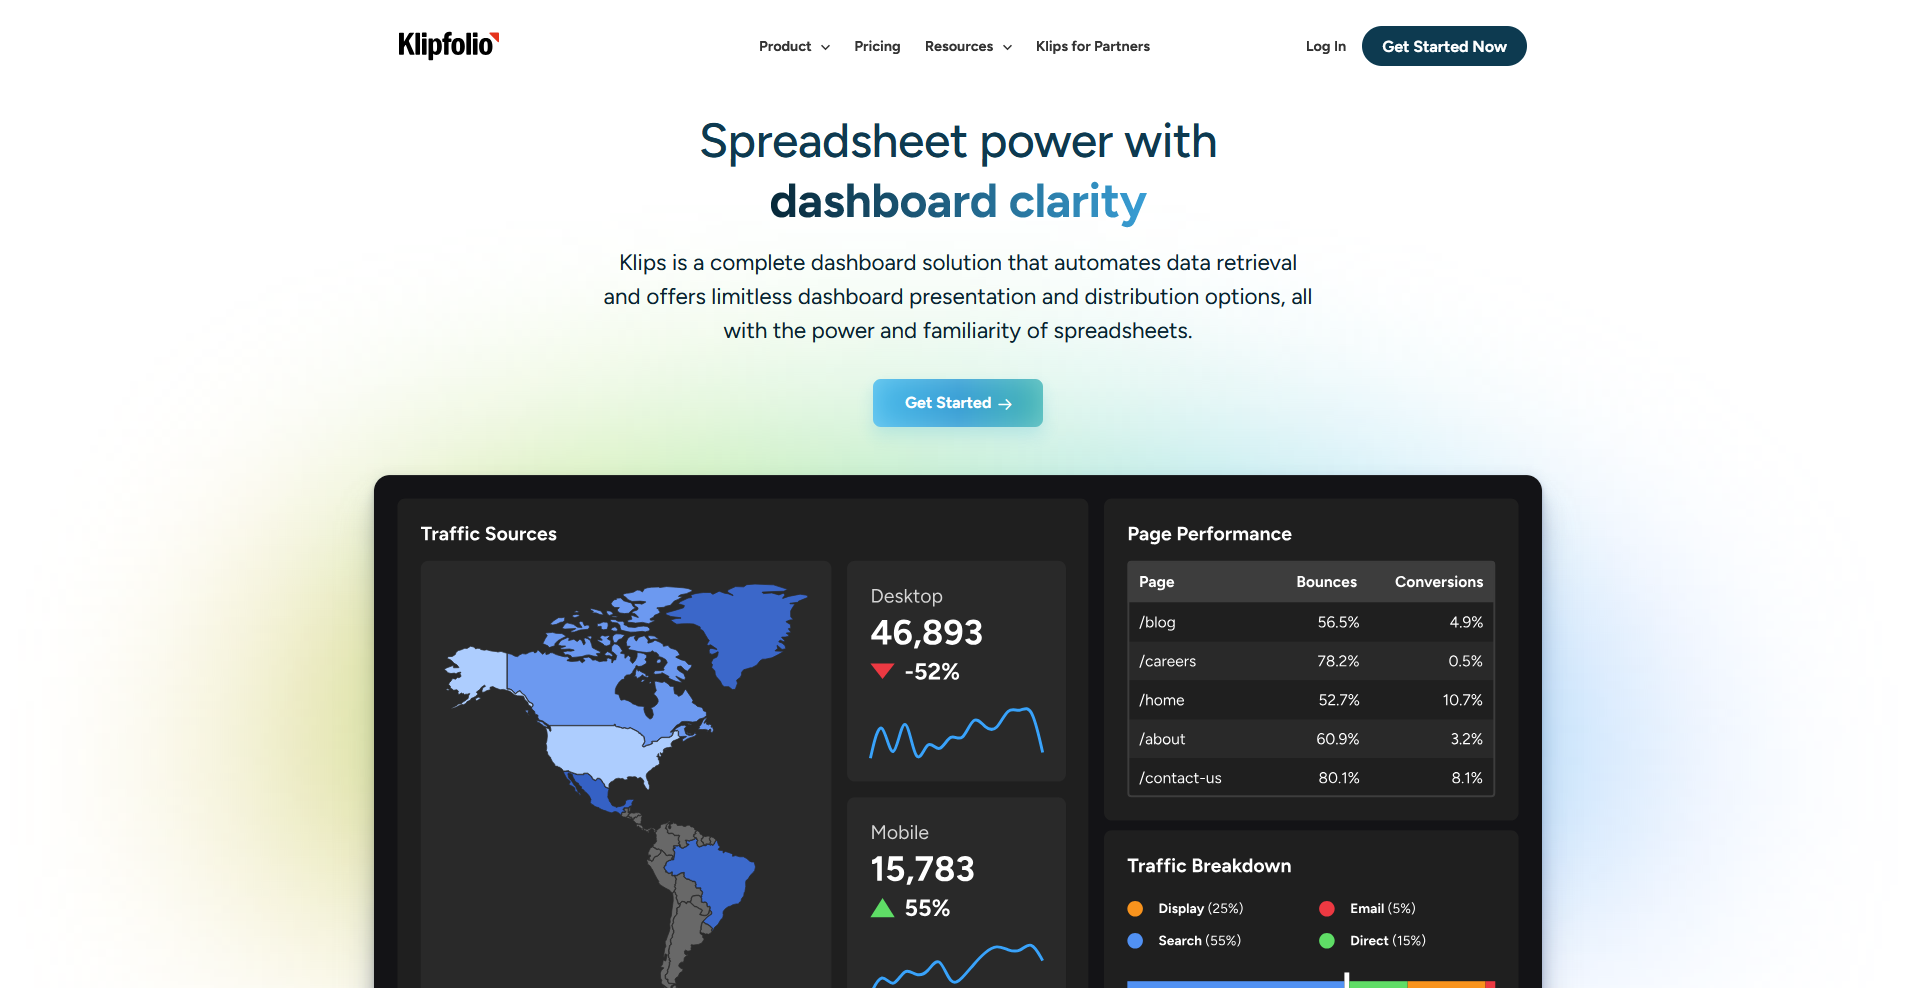
- What it does: Klipfolio lets you build custom dashboards from scratch, blending data from multiple sources into formulas you define yourself.
- Best for: Teams that want full control over how every metric gets calculated instead of relying on preset templates.
I built a dashboard from a blank canvas to test Klipfolio's formula editor. I blended cost data from two mock ad accounts into a single cost per acquisition (CPA) number, and updating a source value triggered an automatic recalculation without any need to rebuild the formula.
The learning curve is steep, so budget enough time before your first dashboard is client-ready.
Key features
- Formula-based metrics: Build custom calculated metrics using a formula editor that pulls from any connected data source.
- Data blending: Combine data from multiple integrations into a single metric or visualization.
- PowerMetrics: A simplified reporting layer for teams that want dashboards without building formulas manually.
Pros and cons
| Pros | Cons |
|---|---|
| Formula editor handles complex, blended metrics that preset tools can't calculate | New users need real time to learn the formula syntax before building a full dashboard |
| Wide integration library covers most marketing and business data sources | Dashboard layout options feel less polished than newer, template-driven tools |
| PowerMetrics offers a simpler path for teams that don't need full customization |
What users say
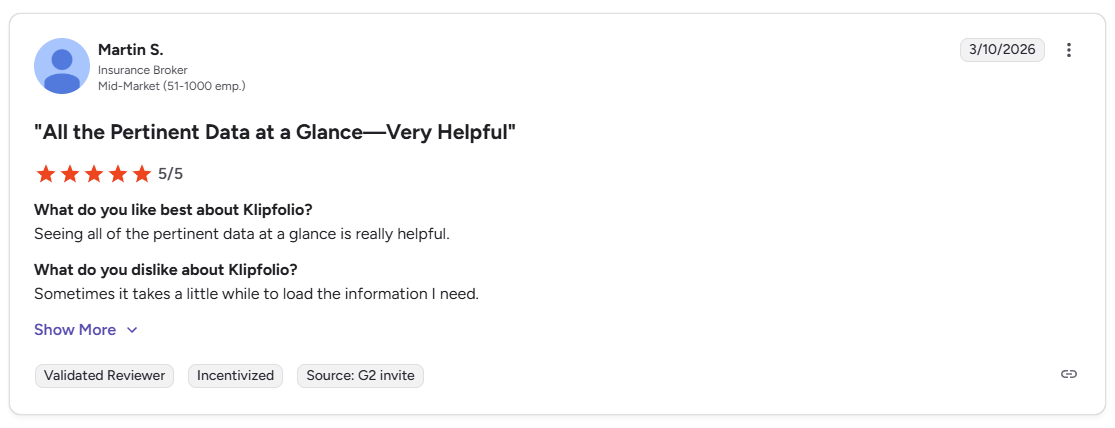
Pro: "Seeing all of the pertinent data at a glance is really helpful." - Martin S., G2
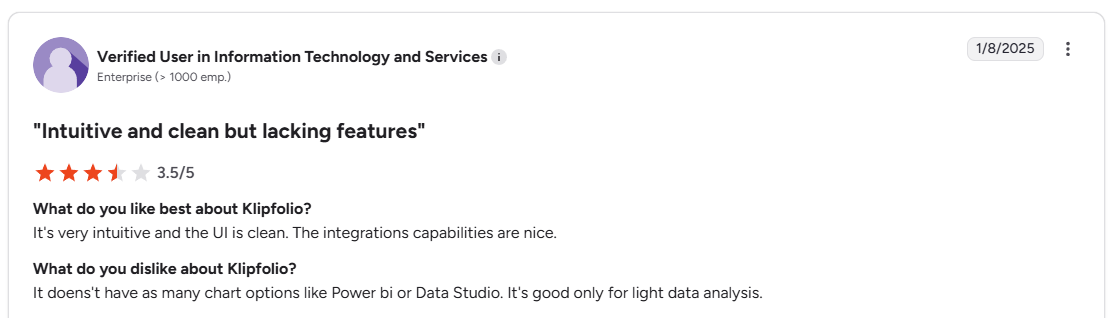
Con: "It doesn't have as many chart options like Power BI or Data Studio. It's good only for light data analysis." - Verified User, G2
Pricing
Klipfolio starts at $120 per month, billed annually.
Bottom line
Klipfolio rewards the setup time with dashboards that can calculate exactly what a preset template can't. If Meta creative performance and ad grading matter more than custom formulas, Atria is worth a look.
4. Databox: Best for KPI monitoring and goal tracking
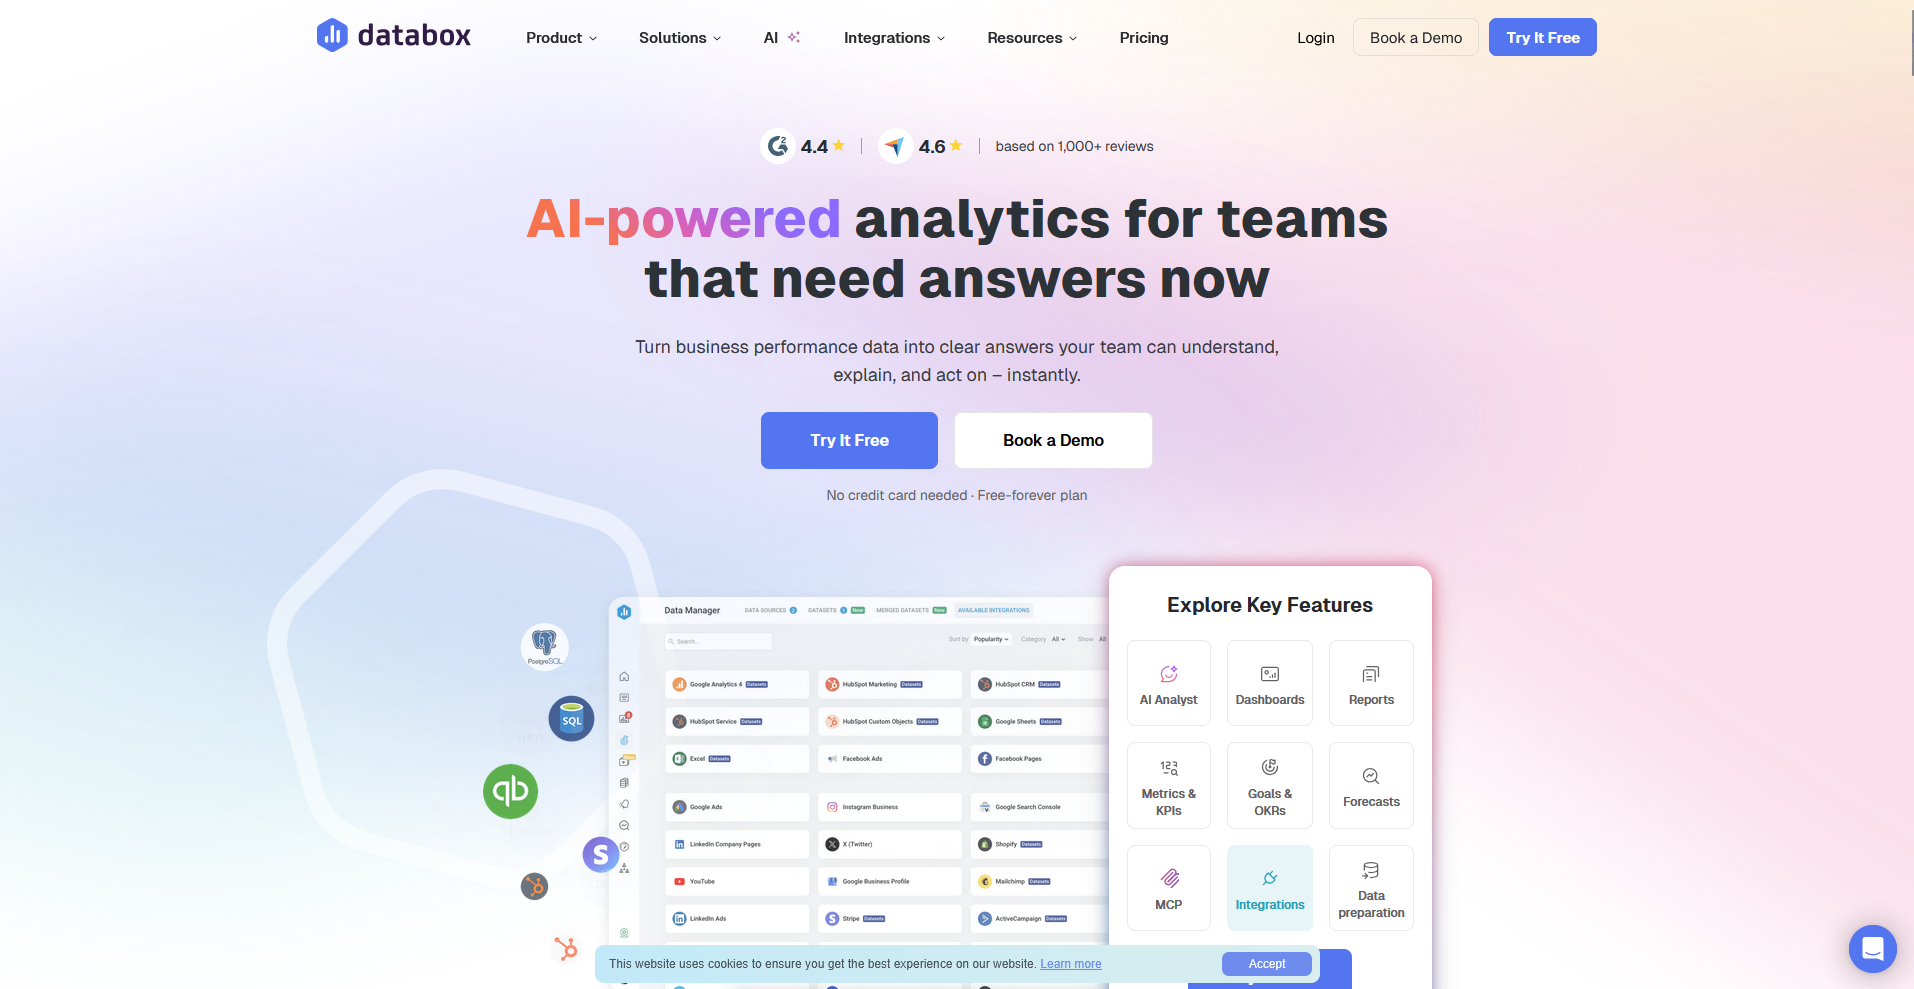
- What it does: Databox tracks marketing and business metrics against set goals, then sends alerts when a KPI moves outside its target range.
- Best for: Teams that need to monitor progress toward specific targets.
To test Databox's goal pacing feature, I set a monthly return on ad spend goal on a mock ad account and tracked how the pacing view updated daily against the target.
I also set a threshold on a test metric and got a mobile alert when it crossed. Some templates from the gallery needed adjustment before the metrics matched what I wanted to track.
Key features
- Goal pacing: Set a target for any metric and see whether performance is tracking ahead of or behind schedule.
- Mobile alerts: Get notified when a KPI crosses a set threshold, without needing to check the dashboard manually.
- Template gallery: Choose from a large library of pre-built dashboards covering common marketing and sales metrics.
Pros and cons
| Pros | Cons |
|---|---|
| Setup takes only a few minutes from connecting an account to a working dashboard | Some templates need manual adjustment to match specific metric needs |
| Works across both marketing and sales data, so client-facing and internal reports can live in one place | Data blending across sources isn't as flexible as tools built specifically for custom formulas |
| The mobile app keeps full dashboard formatting intact on a smaller screen |
What users say
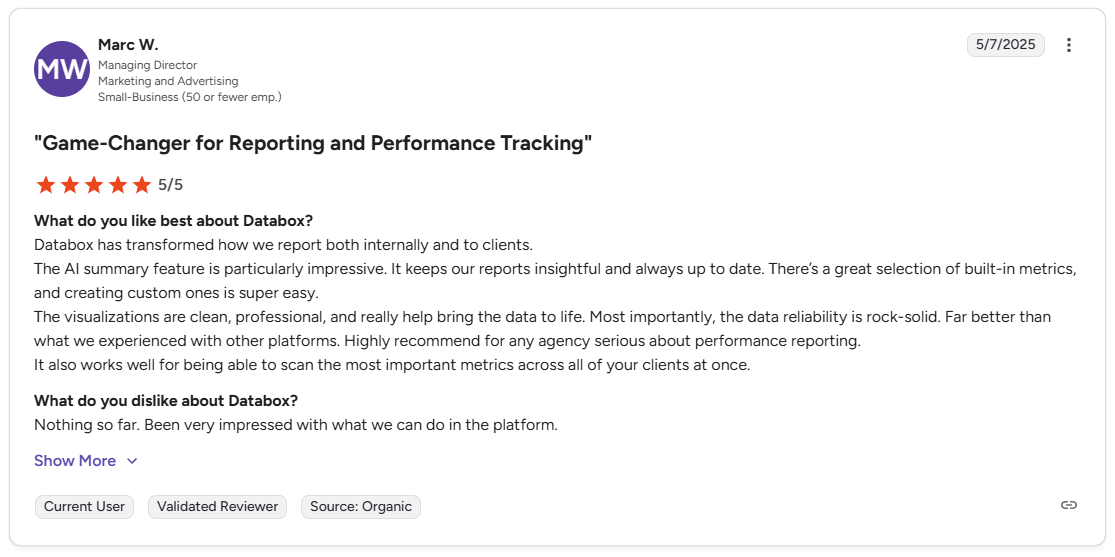
Pro: "Databox has transformed how we report both internally and to clients… The visualizations are clean, professional, and really help bring the data to life… The data reliability is rock-solid." - Marc W., G2
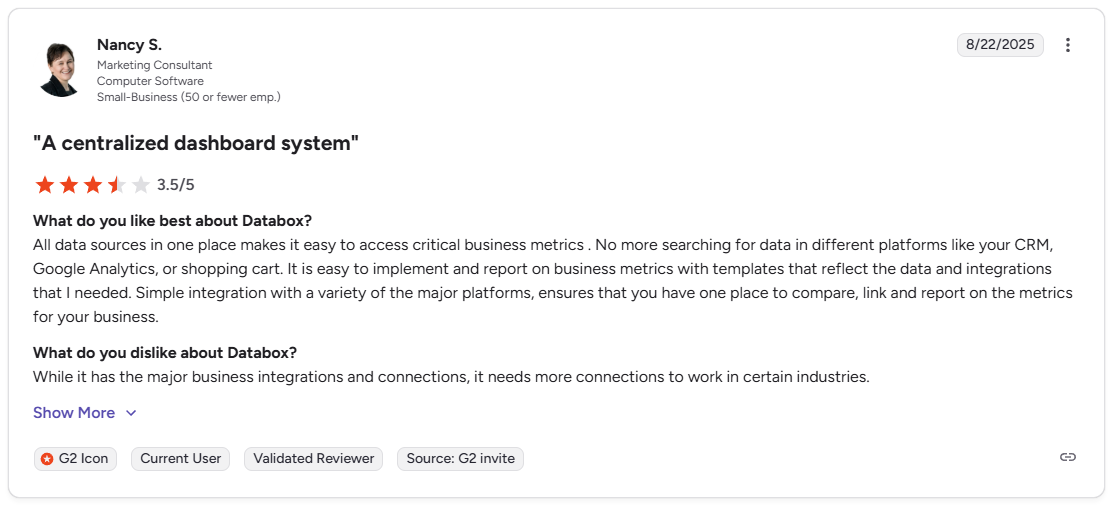
Con: "While it has the major business integrations and connections, it needs more connections to work in certain industries." - Nancy S., G2
Pricing
Databox starts at $64 per month.
Bottom line
Databox ties every metric to a goal, so reporting shows pace toward a target instead of a flat snapshot. If custom formulas and data blending matter more than goal tracking, Klipfolio might be a stronger match.
5. Atria: Best for Meta creative performance reporting

- What it does: Atria grades individual Meta ad creatives and tracks competitor ad activity, built around Meta's ad data.
- Best for: Agencies and teams that need creative-level performance insight on Meta specifically.
We built Atria to help marketers see why a Meta creative works. Its Radar feature grades every ad in plain English with a reason behind the score, so you know which hook or angle to keep testing.
Atria's reporting is focused on Meta, so agencies running other platforms still need a separate tool for that data.
Key features
- Ad grading: Every ad gets a plain-English grade with a specific reason for the score and a suggested fix, generated through Radar.
- Competitor creative tracking: Follow competitor brands and pull their top hooks, angles, and personas from a library of over 100 million ads.
- Creative briefs from Raya: Raya helps build briefs and surfaces what to test next based on account performance and competitor research.
Pros and cons
| Pros | Cons |
|---|---|
| Because every ad is tagged by hook, angle, and format, each grade shows which creative element is driving results, where the other tools here stop at campaign-level spend and ROAS | Reporting is built around Meta, so multi-platform agencies need a separate tool for non-Meta data |
| You can pull competitor creative straight into a client report, so retainer updates show how a brand's ads stack up against the broader market | Report snapshots cover single views and not a full branded client dashboard |
| Radar catches a fading creative before the drop reaches account-level ROAS, so you can swap it in the next reporting cycle instead of explaining the dip after it happens |
What users say
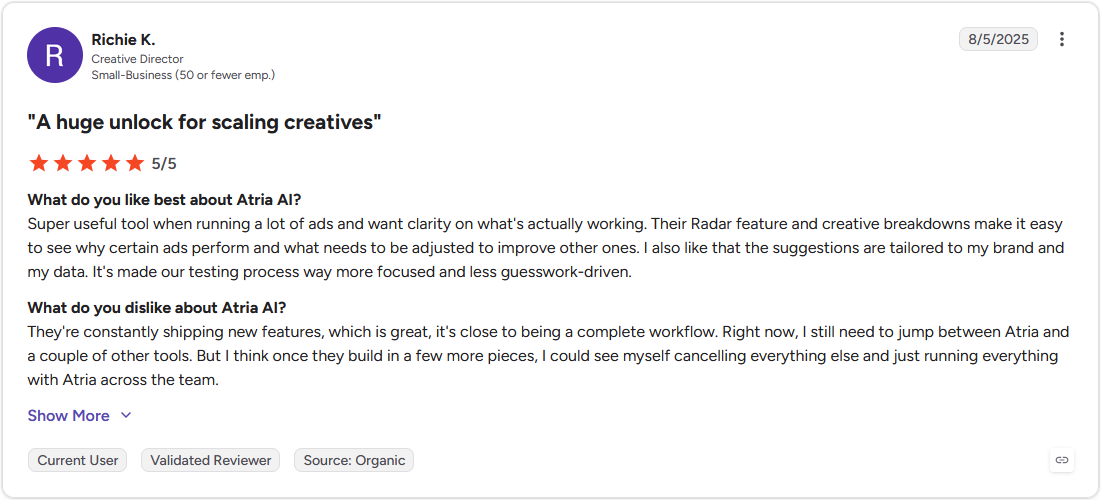
Pro: "Super useful tool when running a lot of ads and want clarity on what's actually working. Their Radar feature and creative breakdowns make it easy to see why certain ads perform and what needs to be adjusted to improve other ones." - Richie K., G2
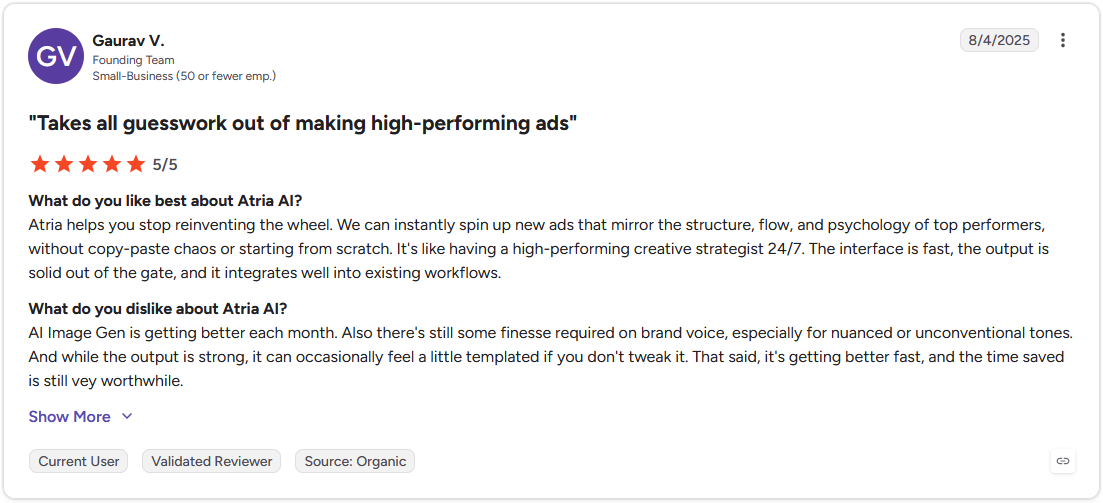
Con: "AI Image Gen is getting better each month. Also there's still some finesse required on brand voice, especially for nuanced or unconventional tones. ... That said, it's getting better fast, and the time saved is still [very] worthwhile." - Gaurav V., G2
Pricing
Atria starts at $129 per month.
Bottom line
Atria's reporting depth comes from creative-level detail. If your reporting needs to span platforms beyond Meta, AgencyAnalytics could be worth a look.
Special mentions
These 7 tools didn't make the top 5, but each one covers a specific reporting need that may fit your agency depending on your client mix and how your team already works.
Here are 7 more agency reporting tools worth a look:
6. ReportGarden
ReportGarden is a reporting and budget tracking tool built for agencies running paid media campaigns.
I set up a mock campaign to see how the budget pacing view performs, and it flagged overspend well before the month closed out. That's the kind of early warning that saves an awkward client call later.
The proposal builder felt like an afterthought by comparison, more of a bonus feature than something built with the same care as the reporting side.
7. Two Minute Reports
Two Minute Reports automates client reports directly inside Google Sheets and Data Studio, skipping the standalone dashboard. That's a solid fit if your team already works out of spreadsheets day to day.
Setup took just a few minutes in my testing, and I had a working report before I'd normally even finish picking a template elsewhere.
But commit to a layout, and there's not much room to change your mind later. Restructuring a built report means starting over, more than editing, so I'd get your layout right the first time.
8. Cyfe
Cyfe is a dashboard tool built to pull marketing, sales, and support metrics into one screen instead of narrowing in on ad data alone.
I liked having social, email, and ad performance sitting side by side during testing, since it cut down on the tab switching that eats up more time than people realize.
A few widgets did load more slowly once I connected multiple sources, so don't expect the same snappiness you'd get from a tool built around one data type.
9. Improvado
Improvado is a data aggregation platform built to centralize marketing data from dozens of sources into one warehouse, and it's clearly designed with a dedicated analyst in mind.
During the demo, it untangled mismatched naming conventions across platforms better than I expected. That's the kind of cleanup that normally eats hours when done by hand.
Just know that the setup and configuration process assumes someone on your team is managing the platform full time.
10. Supermetrics
Supermetrics is a data connector built to pipe ad platform data into spreadsheets and BI tools, and it doesn't try to be anything more than that.
Refreshed data matched the source platform numbers across five of my test pulls, so the pipeline itself held up without any drift I could catch.
It won't build the client-facing report on its own, so pair it with something like Data Studio if that's the deliverable you actually need.
11. Whatagraph
Whatagraph is a report builder focused on visual, polished output, the kind of report that looks finished the second a client opens it.
Automated scheduling sent a weekly report to a test inbox with barely any manual follow-up on my end, which is the whole point of automating this in the first place.
Some of the chart customization settings sat three or four menus deep, and tracking those down slowed me more than expected when matching a specific brand.
12. Signara
Signara is an analytics platform that pairs standard dashboards with written summaries explaining what changed and why, instead of leaving you to interpret a chart cold.
I ran it against a sample dataset with a deliberate dip, and the auto-generated commentary caught it accurately, which says something about how well the analysis works underneath.
It did misread one customized metric name during testing, so I'd still double-check its summary against the raw numbers before sending it to a client.
Which agency reporting tool should you choose?
The right agency reporting tool depends on how many clients you manage, how much customization your reports need, and which platforms you're pulling data from most.
Choose DashThis if you:
- Manage reports for many clients and want a fast, repeatable setup process
- Need white-label branding on every dashboard without extra design work
- Want a wide range of built-in integrations without custom API work
Choose AgencyAnalytics if you:
- Run an agency and need reporting features built specifically for client work
- Want campaign goal tracking alongside standard performance metrics
- Need agency-specific templates instead of building dashboards from a blank slate
Choose Klipfolio if you:
- Want full control over how each metric gets calculated and displayed
- Need to blend data from multiple sources into custom formulas
- Have the time or technical comfort to build dashboards from scratch
Choose Databox if you:
- Want to track progress against specific goals
- Need mobile alerts when a KPI moves outside a set range
- Prefer starting from a large library of pre-built templates
Choose Atria if you:
- Manage Meta ad accounts and need creative-level performance grading
- Want to track competitor ad creative alongside your own account data
- Need reporting that explains which hooks and angles are driving results
Skip this category entirely if you:
- Need a general business intelligence tool for company-wide reporting
- Manage a single in-house account and don't need multi-client or white label features
- Want a tool built primarily for SEO or web analytics reporting
Final verdict
Agency reporting tools are built to show clients what their ad spend produced, but that's not much use when they stop short of explaining why a specific creative is winning or fading.
Atria is a creative intelligence platform built for performance marketers who need reporting tied directly to ad creatives instead of just spend and conversions.
Here's how it can add to your reporting workflow:
- Ad grading: Every ad gets a plain-English grade with specific fixes, so your reports can explain what to change instead of just flagging what's underperforming.
- Creative performance tracking: Atria's Radar monitors every ad on an ongoing basis and sends an alert when a creative starts to decline, so client reports can flag fatigue before it shows up in ROAS.
- Competitor research: Pull top hooks, angles, and personas from competitor brands using a library of over 100 million ads, so your reporting can include market context beyond your own account.
Take a look at how Rubix cut creative analysis time by 40% and lifted ROAS by 15% after moving their creative reporting into Atria.
Want to see what Atria flags in your ad account? See Radar grade your creatives.
Frequently asked questions
What is the best agency reporting tool?
Some of the best agency reporting tools include DashThis, AgencyAnalytics, and Databox, each built for managing multiple client accounts.
DashThis offers fast, repeatable setup across clients, AgencyAnalytics uses agency-specific templates, and Databox focuses on goal tracking. The right pick depends on client volume and how much customization each report needs.
Can agency reporting tools automate client reports?
Yes, agency reporting tools can automate client reports by pulling live data from connected ad accounts on a set schedule. Most platforms send reports automatically on a daily, weekly, or monthly basis. This removes the need to manually export and format data before every update.
What is the difference between agency reporting software and a BI tool?
The main difference between agency reporting software and a BI tool is scope. Agency reporting software focuses on client-facing dashboards for marketing and ad data, while BI tools like Tableau or Power BI handle broader analysis across sales, operations, and finance.