
Creative is the one area that advertisers still fully control as CPMs climb and targeting flattens out.
Meta itself frames this as a strategic shift. In their own words, when they introduced Andromeda, “The focus has shifted from niche targeting to creative diversification as the best lever to find the most relevant audiences.”
That's what creative analysis is for. Breaking an ad down into its components, using a 4-part framework and a weekly workflow to turn what you find into your next winning brief.
What is creative analysis?
Creative analysis is the practice of measuring how your ad creative performs, then using that data to decide what to make next. You look at how audiences respond to your visuals, copy, and format, then feed those findings back into your next brief.
Some teams call this creative analytics instead. Either way, the goal is to turn ad performance into decisions.
It is different from creative strategy. Strategy is the underlying angle behind an ad. A founder-led story, a feature callout, a celebrity campaign.
Creative analysis tells you whether that angle (packaged into an ad) worked.
Why creative analysis matters more in 2026
Here are some of the main reasons why creative analysis is more important than ever:
- The talent bar has risen. Creative people who worked in TV, film, and traditional agencies have moved into paid social, raising the quality. Know what works to avoid being left behind.
- Formats keep multiplying. Video, static, carousel, Stories, and Reels each behave differently. Analysis accounts for the ad and the unit it's shown in.
- Meta's Andromeda system changed how ads get delivered. Meta explains that the more complex model means it can “better personalize ads,” and that Andromeda now works to “pick the right creative to deliver more personalized ads that are relevant and interesting.”
- Two creatives targeting the same audience can end up reaching very different slices of it. Knowing which segment your ad is reaching has become part of the analysis.
- Meta sees it as a move to diversify creative and find the most relevant audiences.
- We go deeper on what this means for creative strategy in our guide to Andromeda and Meta ads.
- Ads burn out faster. Attention researcher Gloria Mark has tracked how long people stay on a single screen task before switching away, dropping from 2.5 minutes in her original study to roughly 40 seconds today.
That's a measure of general task-switching on computers (not ad-viewing specifically) but creative fatigue is tracking the same direction.
Refresh cycles that used to run monthly now need to run closer to every two weeks to keep pace. Either way, the window to catch declining performance is shrinking.
These changes mean the brands succeeding are the ones who keep an analytic eye on their creative process and what they learn from it.
The metrics mistake most businesses make
Metrics fall into two buckets:Primary KPIs (ad spend and results): conversions, purchases, whatever your bottom-line action is. These tell you whether your creative worked or not. The ad either drove the outcome you wanted at a cost you can live with, or it didn't.
Storytelling KPIs: hook rate (also called thumb-stop ratio), hold rate (or watch-through rate), CTR, and engagement. They tell you why your ad might have worked, or why it flopped.
A high hook rate with a weak conversion rate tells a completely different story than a low hook rate with the same weak conversion rate, even though both ads failed by the primary metric.
| Metric type | Examples | What it answers |
|---|---|---|
| Primary KPI | Spend, conversions, purchases | Did this creative work? |
| Storytelling KPI | Hook rate, hold rate, CTR, engagement | Why did it work (or not)? |
Treating a storytelling KPI as a performance verdict on its own is a mistake.
A high hook rate with a weak conversion rate means the opening earns attention but loses people before they act. The fix is often mid-creative, not the first three seconds.
A good CTR with no conversions, however, means the ad's promise is landing, but something after the click (offer, landing page, product-market fit for that audience) isn't working.
With video, hold rate tells a similar story from a different angle. Don't judge it purely on direct conversion. A high hold rate often builds a valuable remarketing audience, so it can be doing upper-funnel work its own ROAS won't show.
A low hold rate paired with a strong hook rate means the opening works but the middle doesn't sustain interest. A mid-video edit is necessary.
If you're only looking at primary KPIs on video, you'll cut winners that were doing upper-funnel work you never measured.
Atria shows hook rate, hold rate, spend, and conversions for each ad in one view. You don't have to dig through different files to figure out which group an ad belongs in.
The 4-part framework for analyzing creative content
Once you know an ad worked or didn't, you need to find out what in particular drove that outcome so you can repeat it.
Most reporting stops at the asset level, telling you that Ad A beat Ad B. This framework works at the element level, by breaking each ad down into the parts that drove the result.
Format
Format here refers to structural format, meaning the shape the ad takes to make its point. A few common ones:
- Us-vs-them: positions your product against an alternative or the status quo
- Features-callout: walks through specific product features, often with on-screen text or annotations
- Founder-led: the founder speaks directly to camera
- Statistic-based: a data point or claim to earn attention
Format alone rarely determines whether an ad converts. Two founder-led ads can perform completely differently depending on everything else in this framework. But it sets the structure.
Creator or talent
Who delivers the message often matters more than the message itself. The same script, read by two different creators, can produce very different results.
One might sound authentic, the other, generic. The person on screen carries meaningful weight in how the ad lands.
Messaging strategy
This breaks further into four sub-buckets. Mapping an ad to one (or several) makes it much easier to spot patterns across your top performers.
- Human desire angle: romance, connection, tranquility, power. Emotional pulls that aren't product-specific
- Demographic angle: speaks to a specific age, role, or hobby
- Big strategic angle: a larger cultural or brand moment, like a celebrity campaign
- Negative or taboo angle: goes into personal history, insecurity, or something less polished or more confessional
Also consider where the messaging sits on the funnel-awareness spectrum, ranging from completely unaware of the problem to most-aware.
A statistic-based ad aimed at an unaware audience does a different job from the same format targeting someone ready to buy.
Imagery
This refers to production quality (lo-fi, phone-shot UGC vs. hi-fi studio production), setting, color palette, movement, and shot angle or POV.
Businesses put much effort into polishing visuals while ignoring messaging or creators. This is a little ironic, since imagery is often the part with the least influence on its own.
Let's consider two ads for the same skincare product.
Ad A is founder-led, human-desire angle (confidence/connection), with hi-fi studio imagery.
Ad B is UGC-format, demographic angle (targeted at a specific age group), lo-fi phone footage.
Both have the same product and the same offer. The truth is they're testing four different variables at once (format, creator, angle, and imagery), which is why a flat “video vs. static” comparison is more of a miss than a hit.
If Ad B wins, the takeaway is that format, creator, angle, and production quality each need to be analyzed separately to know which one drove the result.
That hypothetical shows the mechanics.
Ipsy's team put the same discipline against real spend, using Atria to run this kind of element-level breakdown. They doubled creative volume, lifted ROAS by 25%, and cut CAC by up to 20%.
That's the result of treating every ad as a set of testable parts.
How to structure your analysis workflow (weekly flow)
Knowing the framework doesn't help much if you analyze sporadically. A weekly loop keeps decisions grounded in fresh signals.
Start of week: pull the numbers, then drill down. Start with high-level KPIs, then home in on creative-level data from your top 3 and bottom 3 performers.
Test the losers too. They're often more instructive, because a failed creative tells you which part (format, creator, messaging, or imagery) you need to tweak. It narrows your options faster than another win would.
Identify the trend: look across the top and bottom performers for a pattern. Is one product, angle, or format consistently outperforming? The 4-part framework shines here.
A specific result like “founder-led, human-desire-angle video is winning” gives you a concrete brief you can act on.
Brief the team with specifics: don't be vague. Just saying, “Make it more engaging” doesn't work. Instead, use specific asks, like, “the hook rate is low, change the top three seconds” or “swap the creator but keep the script.”
The more precisely the finding is stated, the less time it takes to get the next version right.
Mid-week: build and scale on early signals. As new creative starts generating data, act on what's already clear instead of waiting for the full week to close out. If something's clearly winning by mid-week, start scaling it.
End of week: launch whatever finished production this cycle. With a roughly two-week production lead time, what goes live this week was usually briefed two cycles before.
In practice, that means running two briefs at once: one identified from this week's analysis and heading into production, and one finishing production from two weeks back and going live now.
Plan around that overlap.
Here are some structural rules that make this loop more reliable.
Judge by spend: a rule of thumb is to wait for roughly 2-3x your average order value in ad spend on a single ad before drawing conclusions. Two ads that have been live the same number of days can have wildly different amounts of signal behind them.
Rotate new creative into existing ad sets rather than spinning up new ones each time. This preserves the ad set's conversion history and baseline performance for a cleaner read on the creative itself.
Treat Stories as their own creative: Stories consumption behaves differently, and creative built for feed often underperforms there for reasons that have nothing to do with the message.
Atria automates this part of the loop too, showing top and bottom performers and hook rate trends.
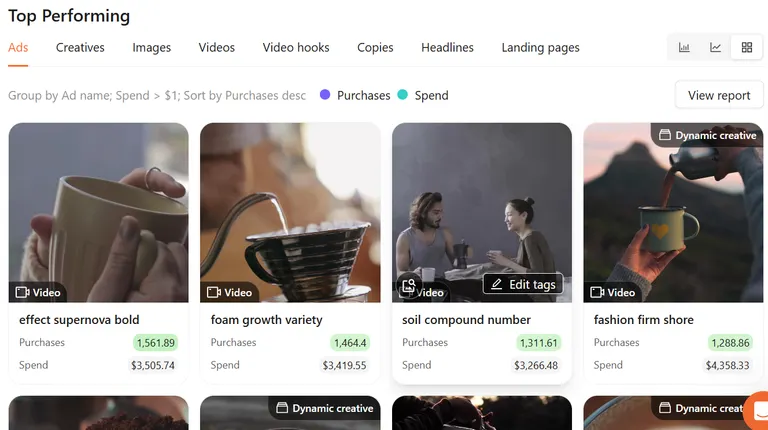
Creative analysis in Atria showing top performers
Naming conventions: the backbone of usable analysis
None of the frameworks above will work if you can't query your data because of a poor naming system. You can save hours by getting this right.
Adopt a consistent hierarchy across three levels:
- Campaign: objective, budget strategy, funnel stage
- Ad set: audience, placement, bid strategy
- Ad or creative: format, product or SKU, creative bucket (UGC, lifestyle, meme, etc.), copy angle
In practice, that hierarchy might look like this. US_Prospecting_Q1_ABO for the campaign, 18to34_Broad_Auto for the ad set, and UGC_SkinSerum_HumanDesire_HL1_BC2 for the ad itself, where HL1 and BC2 point to the exact headline and body copy variant running. Filter on any piece of that string later, and you get every ad that matches.
Benchmarking against yourself and competitors
Numbers on their own don't mean much without something to measure them against. It could be your own past performance or what competitors are running.
Comparison is how you turn “this ad got a 2% CTR” into “this ad got a 2% CTR, which is above our account average but below what our competitors are running.”
Benchmark against your own top performers first: Industry benchmarks are useful, but your own historical top 10% is far more relevant. It accounts for your audience, your price point, and your category in a way a generic number never will.
Then benchmark against competitors regularly: Scan your competitors' creative weekly or monthly to spot recurring visual and messaging patterns.
If three competitors have all shifted from static shots to founder-led videos in the same month, that's a signal about where the category's attention is moving.
This is also the natural point to run a gap analysis if you're starting fresh on an account or launching a new product.
Benchmark what competitors are already doing to define a minimum viable creative set. Then test broad buckets (UGC, lifestyle, flat-lay, motion graphics) before optimizing angles within the winning bucket.
It's a faster way to get useful signals than guessing blindly on angles. If you need the tactical side of this, we cover the mechanics of finding and tracking competitor ads in our guide to spying on Meta and TikTok ads.
Remember to be skeptical of platform-reported lift studies and first-party data pitches from ad platforms themselves. They have an obvious incentive to make their own inventory look effective.
Cross-channel signals, like a lift in branded search volume in Google Search Console following a campaign, tend to be more reliable when it comes to telling whether your creative moved the needle.
Turn analysis into action
Turn what you've found into the next thing you make.
Use feedback and comments as a check. They won't appear in your primary KPIs, but they're a useful signal for where to go next.
If people are asking the same question in the comments of a winning ad, that question is probably worth answering directly in the follow-up creative.
For cold accounts or new products, start broad before you get specific. When there's no historical data to lean on, begin with a competitor gap analysis to establish a minimum viable creative set. What does the category expect to see?
Then test broad creative buckets against each other (like UGC, lifestyle, ecommerce/flat-lay, and motion graphics) before you start optimizing angles or copy within whichever bucket wins.
A few creative non-negotiables, regardless of what your analysis says:
- Show the product clearly: A clever visual metaphor that buries the product is a common way for ads to look impressive but underperform.
- Win the first 2-3 seconds: Social creative can't rely on traditional storytelling structure where you build up to a payoff. Lead with the payoff and backfill context after you've earned the extra second of attention.
Analysis is only useful if it's specific enough to brief off of. “This performed better” cannot be acted on. “This performed better because of the creator.” is better.
Atria helps you run this framework at scale
Everything above works in theory whether you're using a spreadsheet or a dedicated platform.
The difference is in creative velocity. How fast you can move from what you learned to what you make next, every week, without it eating a full day of someone's time.
Auto-tagging is the starting point: Atria auto-tags hook, persona, USP, and format automatically across your Meta and TikTok creative, saving roughly 4 hours a week compared to tagging by hand.
You still bring the creator and imagery parts of the framework to the read, but you're not starting from a blank ad library to do it.
If you're still tagging by hand, we walk through what changes in our guide to automating creative tagging.
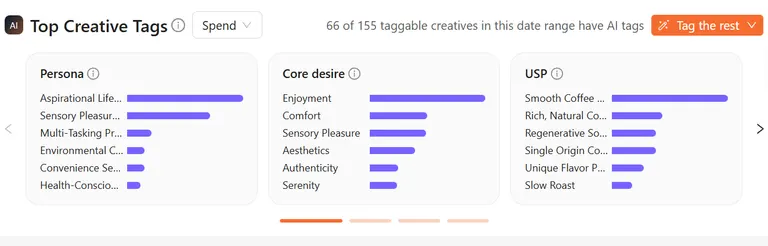
Auto-tagging in Atria
From there, Raya turns that analysis into the next brief: She combines your own ad data with competitor intel and customer research to find the personas, hooks, and messages that are winning, then builds a creative brief around them.
Raya can generate new ad variants from that winning formula and batch-upload them straight to Meta, so the brief becomes a launched ad in one pass.
Radar closes the loop: It grades every ad in plain English with specific fix recommendations, benchmarked against $5.3B of market-wide ad spend data, and flags when a creative starts to decline before it drags down ROAS.
Those grades and alerts become next week's analysis, which becomes the next brief, and the cycle compounds.
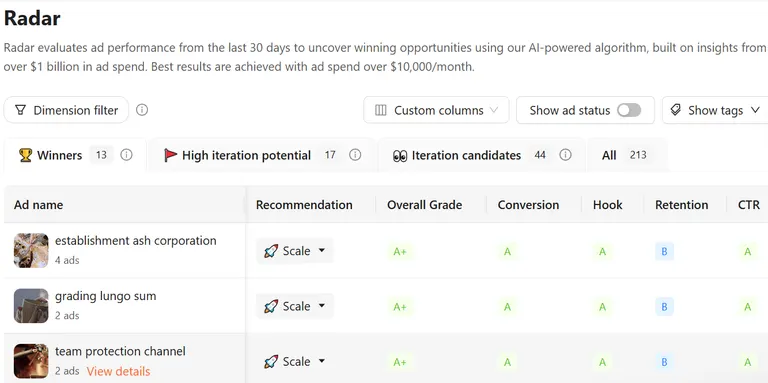
Grading ads in Radar
Using Atria, Rubix (a performance marketing agency) sped up creative analysis and turnarounds by 40%, improved ROAS by 15%, and lowered CPA by 20%.
With Atria's creative intelligence platform, they turned a manual, hours-heavy research process into a systematic weekly workflow their whole team could run consistently.
As Alex Realmuto, Founder and CEO of Rubix, put it: “Atria is phenomenal, especially from a reporting standpoint. It's going to make your life easier, and it's an easy decision when you look at ROI.”
If you're comparing options rather than settling on one, our roundup of best AI ad tools for creative analysis walks through how Atria stacks up against the rest.
Whether you run this framework by hand or let Atria handle the heavy lifting, consistent creative analysis is what turns ad spend into a compounding advantage instead of a string of one-off bets.
Try Atria today without a credit card.
Frequently asked questions
What's the difference between creative analysis and creative testing?
The main difference is that creative testing generates the data and creative analysis interprets it. Testing runs two or more versions of an ad against each other; analysis breaks down why one won across format, creator, messaging, and imagery, so the next test is sharper than the last.
How often should you run creative analysis?
You should run creative analysis weekly, at minimum, for active accounts. Ad fatigue sets in fast on social, so a monthly flow means you're likely reacting to a decline that's already weeks old.
A lighter daily check on primary KPIs, paired with a deeper weekly drill-down, is a reasonable balance for most teams.
What KPIs matter most for creative analysis?
For creative analysis, start with primary KPIs (spend and conversions) to know if a creative worked. Then use storytelling KPIs like hook rate, hold rate, and CTR to understand why.
Treating storytelling KPIs as a verdict on their own, without checking them against conversion data, is the most common way to misread their results.
Do you need a dedicated tool, or can you do this in spreadsheets?
Spreadsheets work at a small scale, particularly if your naming conventions are already clean. Friction sets in as volume grows.
Manually tagging format, creator, and messaging angle across dozens or hundreds of ads every week isn't sustainable long-term. A platform that auto-tags and shows trends starts to pay for itself in the time it saves each week.