
If you've ever pulled up two ad platforms and watched them both claim credit for the same sale, you already know ad attribution isn't always as simple as it sounds.
After testing several attribution models across ad accounts, I can tell you some hold up under pressure, and some just look good in a slide deck. Here's what each one does, where it breaks down, and which model fits your sales cycle without overcomplicating your reporting.
What is ad attribution?
Ad attribution is the process of measuring how much credit each touchpoint deserves for a conversion or goal. It assigns credit across those touchpoints so you can measure which ads are driving results and which ones aren't pulling their weight.
A touchpoint is any interaction a customer has with your brand, including clicking an ad, watching a video, opening an email, or visiting your website.
A customer journey is the full sequence of these touchpoints, starting with first exposure and continuing past the first conversion into repeat purchases and renewals.
8 ad attribution models worth knowing in 2026
There's no single right way to assign credit for a sale, and that's part of why 8 different models exist. Some oversimplify a customer's path to purchase, which can lead you to trust numbers that don't tell the full story.
Here's how each model works, and where it tends to fall short:
1. Last-click attribution
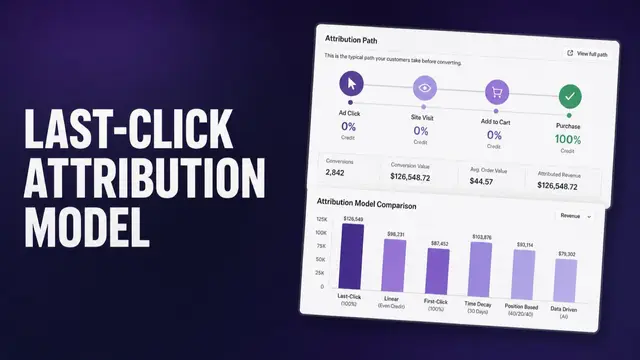
Last-click attribution gives all the credit for a conversion to the final touchpoint before the sale. If someone clicks a Meta ad and buys 10 minutes later, that ad gets 100% of the credit, no matter what they saw or clicked before. There are cases where that is still the right call, which we cover in the last-click attribution model.
When I first started running ads, this was the model I leaned on because it was the easiest to wrap my head around. It can work fine for short sales cycles, where the last ad someone sees is often the one that pushes them to buy.
The tradeoff is that it ignores everything earlier in the journey. I've seen early-funnel ads get cut from budgets because a last-click report made them look like they weren't contributing to anything.
2. First-click attribution
First-click attribution gives all the credit to the very first touchpoint someone has with your brand, even if several other ads and channels influenced the sale after that.
This model can be useful for identifying which channels are bringing in new people. I've found it works best for short buying cycles with only a few touchpoints. Once the journey gets longer and more multi-touch, that first click stops representing what really closed the sale.
That focus on the first touchpoint comes at a cost. Everything after it gets ignored completely, so the retargeting ad or email that closed the sale gets no credit, even if it did the real work.
3. Linear attribution
Linear attribution splits the credit evenly across every touchpoint in the journey. A Meta ad, an email open, and a retargeting click all get the same weight, regardless of how much each one contributed.
I like this model in theory more than in practice. Treating every touchpoint the same sounds fair, but it doesn't mean the numbers end up accurate.
Linear attribution can make sense for longer sales cycles with several channels involved, but it can't tell you which touchpoint pulled its weight.
I once had a top-of-funnel video ad that barely drove a handful of site visits. That ad still got the same credit as the retargeting ad that closed most of our sales that month, simply because linear attribution doesn't ask which one did the heavier lifting.
4. Time-decay attribution
Time-decay attribution gives more credit to touchpoints the closer they happen to the sale. A retargeting ad clicked the day before checkout gets more weight than the Meta ad someone saw three weeks earlier.
This tends to fit longer sales cycles, especially business-to-business (B2B) sales, where a lot of nurturing happens before someone finally converts. The logic makes sense on the surface, since the closer a touchpoint is to the sale, the more likely it is to have played a role in the decision.
But I've never fully trusted that logic. Plenty of people make up their minds early and just take a while to act on it, so the ad that convinced them can end up buried under a pile of touchpoints that happened after the decision was already made.
5. Position-based attribution
Position-based attribution gives 40% of the credit to the first touchpoint, 40% to the last, and splits the remaining 20% across everything in between.
It's built to acknowledge two moments that matter most, the ad that introduced someone to your brand and the one that closed the sale, without ignoring the middle entirely, but the 20% split in the middle rarely reflects what happened.
A touchpoint that did the work, like an email that finally addressed someone's biggest objection, ends up with the same sliver of credit as an ad they barely noticed.
6. Lead-conversion touch attribution
Lead-conversion touch attribution assigns credit to the specific touchpoint that turned someone into a lead, like a form fill or a demo request.
This model works well if your team cares more about lead generation than the final sale, since it isolates the exact moment someone showed interest. In my experience, sales and marketing teams that split responsibility at the lead stage tend to like it for that reason.
Keep in mind that this model has nothing to say about what happens after the lead comes in. If a prospect sits in your pipeline for months before closing, it won't tell you what pushed them over the finish line.
7. Custom attribution
Custom attribution lets you build your own rules for assigning credit, based on your specific channels, sales cycle, and customer behavior.
I've worked with custom models before, and they're the most accurate option if you have the data and the resources to build one properly. That flexibility usually only pays off for larger teams with dedicated analytics resources.
For most brands, custom attribution is overkill. Building and maintaining your own model takes an ongoing investment that's hard to justify without a dedicated analytics team behind it.
8. Data-driven attribution
Google’s data-driven attribution uses machine learning to calculate how much credit each touchpoint deserves, based on your own account's conversion data, instead of following a fixed rule like the other models here.
I'd treat this as the direction Google is clearly pushing advertisers toward. It's the default for most new conversion actions, and it tends to outperform fixed models once you've got enough conversion volume for the algorithm to learn from.
The catch is that it works best with volume. Google recommends at least 200 conversions and 2,000 ad interactions in a 30-day period for the model to identify patterns accurately. Below that, it still works, but with less data to learn from, so the credit it assigns may be less precise.
How to choose an attribution model
The right model depends on how long your sales cycle runs, how many channels you're using, what you're trying to measure, and how complex your customer journey tends to be.
Ask yourself these questions before you settle on one:
- How long is your sales cycle? Shorter cycles tend to work fine with simpler models like last-click. Longer, more considered purchases usually need a model that accounts for multiple touchpoints, like time-decay, linear, or position-based.
- How many channels are you running? A couple of channels makes single-touch models easier to justify. Once you're spread across several, I've found multi-touch models give a clearer picture.
- What's the campaign trying to do? Brand awareness campaigns tend to work best with first-click or lead-conversion touch, since both credit the moment someone first engaged. Bottom-funnel campaigns built to close sales often lean on last-click or time-decay instead.
- How complex is the customer journey? A straightforward path from ad to purchase doesn't need much nuance. In my experience, a journey with several stages and decision-makers usually calls for something more layered, like position-based or custom attribution.
Here's a quick-reference recap of all 8 models:
| ❓Model | ⚡Best for | 🔍Watch out for |
|---|---|---|
| Last-click | Short sales cycles, few touchpoints | Ignores everything before the final click |
| First-click | Measuring which channels bring in new people | Ignores everything after that first touchpoint |
| Linear | Longer cycles with several channels | Can't tell you which touchpoint mattered most |
| Time-decay | Longer, B2B-style sales cycles | May undervalue the touchpoint that sparked the decision |
| Position-based | Highlighting the first and last touchpoint | The middle 20% rarely reflects what happened |
| Lead-conversion touch | Teams focused on lead generation | Says nothing about what happens after the lead |
| Custom | Teams with dedicated analytics resources | Requires ongoing investment to build and maintain |
| Data-driven | Accounts with enough conversion volume for the algorithm to learn from | Needs sufficient data to work well, otherwise it defaults to less reliable estimates |
Why ad attribution matters (and gets harder) on Meta
Ad attribution shows you which ads are earning your return on ad spend (ROAS) and cost of acquisition (CPA) numbers. Without it, you're probably guessing which campaign gets credit based on timing instead of proof.
Meta Ads often show up early in the customer journey, sometimes as the first ad someone sees, sometimes as a retargeting nudge right before they buy. If that early influence doesn't get credit, you risk cutting budget from campaigns doing the heavy lifting.
Measuring any of this accurately has also gotten harder, since a few things are working against you:
- iOS opt-outs: Most iOS users decline Apple's App Tracking Transparency prompt. The industry-wide opt-in rate was only 35% in 2025. This means Meta still can't see what happens next for roughly 2 in 3 iPhone users.
- Safari's tracking limits: Safari's Intelligent Tracking Prevention caps script-set first-party cookies at 7 days, unrelated to the Chrome cookie changes people usually blame.
- Multi-device journeys: Someone sees your ad on their phone, converts on a laptop that night, and Meta can't always connect the two.
Meta's Conversions API helps recover some of that lost signal by sending conversion data straight from your server.
Businesses that add Conversions API alongside their pixel have seen results: Axis Max Life Insurance saw a 17% lower cost per acquisition and a 40% increase in quality leads after implementation, according to Meta's own case study.
Meta's ad delivery system, known as Andromeda, uses your conversion signals to help decide which of your ads reach the auction for a given user. A weaker signal means Andromeda is training on a distorted picture of what's actually working.
In-platform attribution settings on Google and Meta
Google and Meta each handle attribution differently, so it's worth knowing what your options look like on each platform before you set anything up.
Let's go over Google Ads and Meta below:
Google Ads
Google Ads used to offer 6 attribution models, but that's changed. As of 2026, only 2 models remain: last-click and data-driven attribution.
The other 4 (first-click, linear, time-decay, and position-based) were deprecated for low adoption, and any conversion action still using one of them got automatically upgraded to data-driven. In my experience, this makes the decision easier.
Data-driven attribution is Google's default for most new conversion actions, and it uses your own account's data to calculate how much each interaction contributed, instead of following a fixed rule.
Last-click is still there if you want it, but it's the exception now instead of the standard.
Meta
Meta's setup works differently from Google's. Instead of choosing one model, you pick an attribution model, either standard or incremental. If you go with standard, you also choose which types of conversions get credited and over what time period.
Standard attribution breaks down into three settings:
- Click-through: Counts conversions within 1 or 7 days of a link click.
- View-through: Counts conversions within 1 day of someone seeing your ad without clicking.
- Engage-through: Counts conversions within 1 day of a non-link interaction, like a comment or share, or watching a video for at least 5 seconds.
I'd default to click-through with the 7-day window for most Meta campaigns, since it captures intent without overcrediting your ads for purchases that had little to do with what someone saw.
If you're running a quick, low-consideration offer, the 1-day version keeps your reporting tighter.
3 attribution tools worth knowing
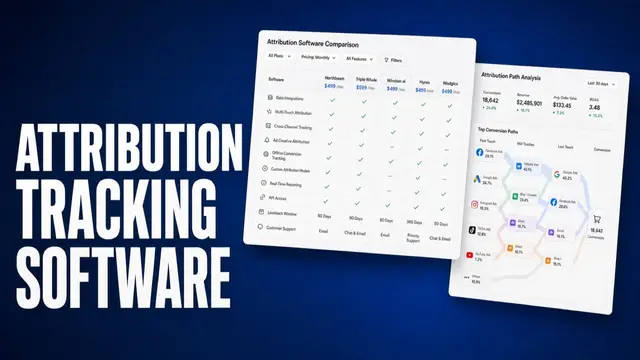
Once you've picked a model, the next question is what measures it for you. Google and Meta's built-in settings work fine on their own, but I’ve found that plenty of teams reach for a dedicated tool once they need a fuller view across channels.
Here's what a few of the popular options bring to the table:
- Triple Whale: Started as an e-commerce attribution and reporting platform, though it's expanded into broader AI-driven analytics and automation since.
Brands use it to pull pixel data, ad account data, and revenue numbers into one dashboard, and its AI agent (Moby) now handles some of the analysis and reporting that used to be manual.
- Northbeam: A multi-touch attribution tool built to give brands a cross-channel view beyond what any single ad platform reports on its own. It's grown into media mix modeling and deeper ad-platform integrations too, so it's less of a pure attribution dashboard now and more of a broader measurement suite.
- Atria: A creative intelligence platform that analyzes your ad account, competitors, and market data, and turns that analysis into a specific next test rather than a static report.
💡 Tip: If you also sell on Amazon, Amazon's own attribution stack (Amazon Attribution and Amazon Marketing Cloud) is worth a look too, since it's built specifically to measure how your non-Amazon marketing channels perform on Amazon sales.
Common mistakes to avoid with ad attribution
Even with the right model picked, a few habits can wreck your data before you notice. Watch out for:
- Mixing up the attribution window and the reporting window: These control different things. The attribution window decides which conversions get counted and optimized toward. The reporting window just filters what you see in your dashboard. Double-check both before assuming you're looking at complete data.
- Changing settings mid-campaign: Switching your attribution model or window on a live campaign breaks your ability to compare before-and-after performance. I'd test changes on new campaigns instead of ones already running.
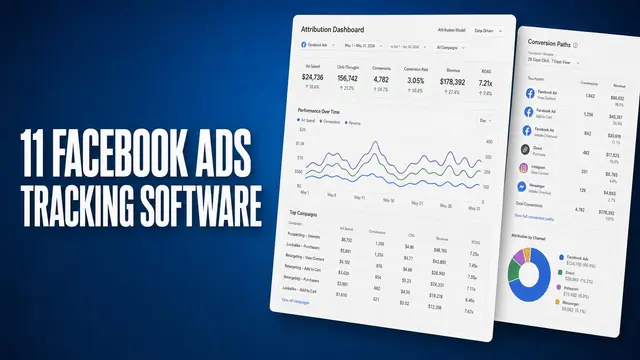
- Trusting one platform's numbers as the whole picture: Meta can only see what happens inside Meta. If someone converts after also seeing a Google ad or an email, that dashboard won't reflect it, and neither will Google's dashboard.
- Ignoring how long your sales cycle actually is: I've seen accounts running a 1-day click window on a product that takes customers over a week to decide on, which can hide a chunk of real conversions.
- Assuming attribution data is exact: Signal loss from iOS opt-outs, ad blockers, and cross-device journeys means most attribution numbers are an estimate. I'd treat them as directional rather than exact.
Turn your attribution data into your next winning ad
Ad attribution tells you which ads are earning credit for a sale, but knowing that is only half the job. The harder part is doing something with it before your next campaign launches.
Atria is a creative intelligence platform that takes your attribution and performance data and turns it into a plan for what to test next, based on what's already working in your account.
Rubix, a performance marketing agency, used Atria to cut creative analysis time by 40%, lift ROAS by 15%, and lower CPA by 20%.
Here's how it can support your attribution work:
- Ad grading: Every ad gets a plain-English grade tied to its performance data, so you can see which touchpoints are earning their credit and which ones are riding along.
- Creative performance tracking: Atria's monitoring feature (Radar) tracks your ads continuously and flags creative fatigue early, so a shift in attributed results doesn't sit unnoticed for weeks.
- Competitor research: Pull hooks, angles, and personas from a library of over 100 million ads, so your next test is informed by more than just your own account's attribution data.
- Auto-scaling and auto-pausing: Winners get more budget and underperformers get paused automatically, based on the same conversion signals your attribution model is already tracking.
- Native in Slack: Atria runs inside Slack, so you get ad performance updates and next-step recommendations where your team already works, no separate dashboard login required.
Ready to see what your attribution data is actually telling you? Try Atria for free today.
Frequently asked questions
What is the Difference Between Attribution and Incrementality?
Attribution assigns credit to specific touchpoints that led to a conversion, while incrementality measures whether an ad caused a sale that wouldn't have happened otherwise.
Attribution answers which ad gets the credit. Incrementality answers whether the ad mattered at all, since some attributed conversions would have happened anyway.
What is the Best Attribution Model for Small Budgets?
Last-click attribution works best for small budgets, since it requires no extra data collection and runs on any ad platform's built-in reporting. It's simple to read and doesn't need the conversion volume that data-driven or custom models require to work accurately.
Does Apple's Privacy Framework Still Affect Ad Attribution Accuracy?
Yes, Apple's App Tracking Transparency framework still affects ad attribution accuracy by letting users opt out of cross-app tracking. Many iOS users decline the prompt, which limits how much Meta and other platforms can see about conversions on those devices.
What is Multi-Touch Attribution?
Multi-touch attribution assigns credit across several touchpoints in a customer's journey, instead of giving all the credit to one interaction. Models like linear, time-decay, and position-based attribution fall under this category, each splitting credit differently.
What Are W-shaped and Z-shaped Attribution Models?
W-shaped attribution gives 30% credit to the first touchpoint, lead conversion, and opportunity creation, and splits the rest among other touchpoints.
Z-shaped attribution gives equal credit (22.5%) to first touch, lead conversion, opportunity creation, and customer close, and splits the remaining 10% among other touchpoints. Both suit longer, complex B2B sales cycles.