
We pulled 2026 creative-cost and CAC data, ran the math against two opposite brand profiles, and built a formula that gives you a starting Facebook/TikTok budget split in about five minutes without blowing past your target CAC.
TL;DR: Facebook Ads vs. TikTok Ads
- No universal winner: split your budget between Facebook and TikTok instead of picking one.
- Calculate your split from three inputs: audience age distribution, CAC margin room, and your weekly creative production capacity.
- Published benchmarks disagree with each other: use your own account's rolling 30- to 60-day blended CAC as your baseline instead of a borrowed CPM table.
- Budget for creative production separately from media spend: TikTok creative typically burns out in 3 to 7 days, while Facebook creative lasts 2 to 4 weeks.
- Last-click attribution undercounts TikTok: run a simple incrementality test before you cut spend based on platform-reported ROAS alone.
How the two platforms differ at a glance:
| TikTok | ||
|---|---|---|
| Audience skew | Older, broader reach | Younger, Gen Z-skewing |
| Targeting model | Audience-first, then creative | Creative-first, the creative is the targeting signal |
| Creative lifespan | 2 to 4 weeks before CTR drops | 3 to 7 days before burnout |
| Attribution default | 7-day click, 1-day view | Leans on in-app, click-adjacent signals |
The short answer: most brands should run both. Here's how to split the budget
For most scaling e-commerce brands, running both platforms is better than betting everything on one auction.
Facebook gives you reach, older buyers, and a stable algorithm. TikTok gives you cheaper impressions, strong visual discovery, and fast creative feedback.
Calculate your split from three inputs:
- Audience age distribution: where your buyers spend time
- CAC target vs. current blended CAC: how much margin room you have to test
- Creative production capacity: how many fresh video assets you produce each week
If you can't pump out new creative consistently, tilting your budget toward TikTok will burn cash fast. And if your core buyer is over 40, Facebook gives you immediate efficiency. We'll walk through the exact math later in this guide.
Why every "TikTok vs. Facebook" benchmark table disagrees with the next one
Search "Facebook vs TikTok ad costs", and you'll find dozens of conflicting tables. One blog says TikTok CPMs run 40% cheaper than Meta, while another shows them nearly identical, and a third claims Meta's cost per purchase is half of TikTok's.
These guides are averaging wildly different data sets and presenting the average as universal truth.
Why that happens
Third-party tables blend variables that should never share one number:
- Geographic mixing: Global averages blend Tier 1 markets like the US, where CPMs often exceed $20, with cheaper international inventory.
- Campaign objectives: Reach and video-view campaigns cost a fraction of conversion campaigns. You corrupt the baseline if you blend them.
- Vertical variance: A low-margin fast-fashion brand faces a completely different auction than a high-ticket home goods advertiser.
What to use instead of a borrowed benchmark
Build your baseline from your own account's rolling 30- to 60-day blended CAC.
Pull total ad spend across both channels and divide it by total net new customers over that period to get your real baseline.
For example, if your 30-day blended CAC is $42 against a $50 target, you have room to test TikTok. If it's sitting right at your margin limit, it's better to skip the speculative testing until you stabilize your primary channel.
How each algorithm decides who sees your ad
TikTok's algorithm serves ads mostly by creative signal. Your video is your targeting filter: strong early watch time and engagement tell the algorithm who to show it to next, regardless of who you thought your audience was.
That's why a TikTok ad can find an audience you never targeted, and why a weak hook gets buried even inside the right audience.
Facebook works the other way.
You define the audience first, using demographics, interests, and lookalikes, and the algorithm optimizes your creative delivery inside those boundaries. A strong Facebook ad still needs the right audience, since a weak audience limits what even great creative can do.
On TikTok, a targeting problem often looks like a creative problem. On Facebook, a creative problem can hide inside a targeting problem. You'll fix the wrong thing if you diagnose them backwards.
What running both Facebook and TikTok ads takes
Scaling spend across both networks means solving a creative supply chain problem. Most media buyers skip that cost when they map out channel budgets.
TikTok and Meta burn through creative at very different rates, and it ends up as production overhead.
Creative refresh cadence by platform
Creative fatigue hits TikTok much faster than Facebook. TikTok users scroll fast, and the algorithm leans hard on early watch time and visual novelty.
TikTok Ads creative typically burns out within 3 to 7 days if you push a significant budget behind it. That lines up with TikTok's own Smart Creative tool, which auto-pauses underperforming videos within the first 3 to 5 days, and with independent benchmarks showing TikTok's typical 7-day performance drop-off.
To keep spend steady without CPA spikes, plan for 3 to 5 new creative variations per week, per active campaign.
Facebook ad sets hold up longer. Meta's algorithm spreads impressions across feeds, stories, and Instagram Reel ads. That spread means a strong winning asset often stays efficient for 2 to 4 weeks before CTR drops.
What that costs in production terms
Running both channels means you budget for asset creation alongside media spend.
The tiers below are a rule of thumb. We built them by mapping published 2026 UGC and agency pricing data onto typical spend brackets. Your real costs will change with your niche, usage rights, and creator experience.
Here's what creative volume looks like across three monthly spend tiers:
Small Tier ($5,000 to $15,000 monthly spend)
- Assets needed: 8 to 12 net-new video assets per month.
- Production route: In-house UGC or low-cost creator packages. Published 2026 benchmarks put the average UGC creator video at $198 per deliverable, down 44% year over year as creator supply grew.
- Implied monthly creative cost: $1,200 to $2,500.
Medium Tier ($15,000 to $50,000 monthly spend)
- Assets needed: 16 to 25 net-new video assets per month, including iterations of winning hooks and CTAs.
- Production route: Dedicated UGC agency or freelance creator team, where per-video rates commonly run $250 to $500.
- Implied monthly creative cost: $4,500 to $10,000.
Large Tier ($50,000+ monthly spend)
- Assets needed: 40+ assets per month, mixing studio production, UGC, dynamic variations, and high-production formats like playable ad formats.
- Production route: Full agency retainer or a dedicated internal editor plus UGC coordinator. Agency retainers for ongoing production commonly run $4,000 to $8,000 per month. Brighter Click's published tiers sit at $4,500 for 12 videos and $6,500 for 18, usage rights included.
- Implied monthly creative cost: $12,000 to $15,000+.
Allocating 30% of your budget to TikTok without scaling creative to match stalls budget fast. Fatigue catches up with it.
Note: These ranges assume a blended mix of creator and editor rates, not a straight multiplication of the per-video figures above.
Attribution: why last-click makes TikTok look worse than it is
You'll usually get the wrong answer if you judge TikTok by standard last-click analytics. Brands check Google Analytics 4, see low last-touch conversions, and kill their TikTok campaigns too early.
The view-through/last-click mismatch
TikTok is a discovery platform, which means users rarely leave the app on their first interaction. Someone watches your ad, remembers your brand, and searches for you on Google three days later.
Under a strict last-click model, Google Search gets 100% of the credit. TikTok gets zero credit, even though it sparked the demand.
Meta's view-through matching and cross-device tracking catch more of that post-impression activity, which is why Meta's numbers look more reliable on a single-touch dashboard.
How to check for it yourself
Skip single-touch attribution. Measure real revenue lift with a simple incrementality test:
- Establish a baseline: Run both channels normally for two weeks. Log daily ad spend, platform-reported ROAS, and total store net revenue. Watch your standard ad performance metrics for cost stability.
- Execute the pause: Pause all TikTok ad spend completely for 7 to 10 days. Don't touch your Facebook or search budgets during this window.
- Measure the delta: Track your store's total blended revenue during the pause.
- Calculate true impact: If revenue drops more than the spend you pulled, or blended CAC climbs, TikTok was driving assisted conversions your last-click model never counted.
The budget-split framework
Build a starting allocation from your actual capacity and audience profile.
Three inputs
Pull three numbers from your brand to calculate your split:
- Audience Age Share (A): The percentage of your existing customer base under age 35.
- Margin Room (M): The gap between your current 30-day blended CAC and your maximum target CAC, scored 0.0 to 1.0. At your hard CAC ceiling, score it 0.1. With 30%+ margin headroom, score it 1.0.
- Creative Production Score (C): Your team's weekly net-new asset capacity. Under 3 assets a week scores 0.2, 3 to 7 assets scores 0.6, and 8 or more scores 1.0.
The actual calculation
The weightings below (0.4/0.3/0.3) are our starting framework as opposed to an industry standard. They give you a defensible first number. Adjust them as you learn how your account actually responds to spend.
Use this formula to determine your TikTok Allocation Percentage:
TikTok % = (A × 0.4) + (M × 0.3) + (C × 0.3)
Subtract your TikTok percentage from 100% to get your Meta (Facebook/Instagram) baseline allocation.
If your TikTok share lands below 15%, keep 100% on Meta until your creative volume or margin room improves. A 10% media split adds operational friction without giving you enough data to optimize.
Here's how the math plays out for two different brand types:
Example 1: Visual & Impulse Brand (Skincare/Apparel)
- Monthly Media Budget: $40,000
- Target CAC: $71 | Current Blended CAC: $54 (High Margin Room: M = 0.8) based on 2026 median CAC for beauty and personal care ecommerce brands.
- Under-35 Audience: 65% (A = 0.65)
- Creative Output: 10 new UGC videos/week (C = 1.0)
TikTok % = (0.65 × 0.4) + (0.8 × 0.3) + (1.0 × 0.3) = 0.26 + 0.24 + 0.30 = 0.80 (80%)
- Starting Split: $32,000 TikTok (80%)/$8,000 Facebook (20%)
- Why it works: High creative throughput matches TikTok's fast fatigue rate. Strong margin headroom absorbs the testing variance.
Example 2: Considered Purchase Brand (Home Ergonomics / Premium Tech)
- Monthly Media Budget: $40,000
- Target CAC: $112 | Current Blended CAC: $103 (Tight Margin Room: M = 0.2) based on 2026 median CAC for home and lifestyle ecommerce brands
- Under-35 Audience: 20% (A = 0.20)
- Creative Output: 2 new video assets/week (C = 0.2)
TikTok % = (0.20 × 0.4) + (0.2 × 0.3) + (0.2 × 0.3) = 0.08 + 0.06 + 0.06 = 0.20 (20%)
- Starting Split: $8,000 TikTok (20%)/$32,000 Facebook (80%)
- Why it works: Limited asset production and an older buyer base favor Meta's longer creative lifespan and sharper targeting.
For agencies: reconciling the split across a book of clients
If you manage budget splits across dozens of accounts, you'll discover that clients read platform-reported ROAS at face value.
If a client sees a 3.2x ROAS in Meta Ads Manager and a 1.4x ROAS in TikTok Ads Manager, their first instinct is often to cut TikTok completely. Don't manage budgets off raw platform dashboards, or you'll keep optimizing into siloed, inaccurate data.
Why you can't compare platform ROAS across clients without a shared attribution baseline
Meta and TikTok use fundamentally different attribution models by default.
Meta defaults to a 7-day click, 1-day view window. It claims credit for a purchase made within a day of someone seeing your ad in their feed, even if they never clicked it. TikTok leans harder on in-app, click-adjacent signals, since its view-through options are less mature.
You'll be measuring distance in two different units if you compare the two platforms' reported metrics directly.
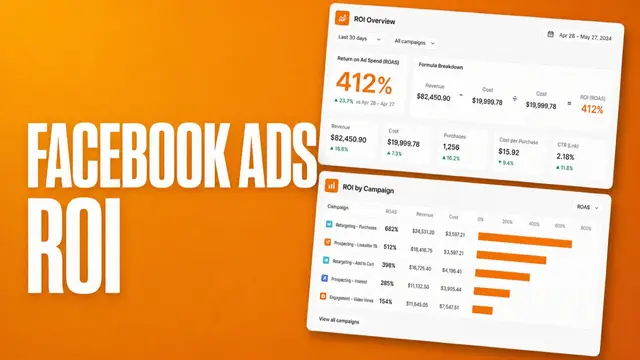
Evaluate your whole client roster fairly by calculating true Facebook ads ROI alongside total blended CAC (total spend across all channels, divided by total net orders). Judge both platforms by their impact on the client's bottom line, and the platform-level reporting gaps stop driving your media strategy.
Using competitive and creative benchmarking to justify a reallocation
Replace your opinion with hard data when presenting a budget shift to a client.
Whether you want to move 30% of a client's budget into TikTok, or scale up their Meta spend, ground the recommendation in competitive research and real benchmarks:
- Audit competitor channel activity: Pull competitor creative across both platforms. Atria tags hooks, angles, and formats automatically, so you can show a client how brands in their vertical split creative between Meta and TikTok.
- Benchmark asset decay rates: Show the client how fast their current assets fatigue against industry standards. High frequency and falling CTR on Meta? Fresh creative on TikTok cuts audience saturation.
- Set clear testing thresholds: Tie every reallocation to a specific performance trigger. Agree upfront that the secondary channel holds your target blended CAC for 30 days, or the budget reverts to the primary platform automatically.
The verdict
There's no universal winner in the Facebook Ads vs. TikTok Ads debate.
Your optimal split is a ratio calculated from your audience, your CAC headroom, and your weekly creative capacity.
Master those three inputs, update your baseline monthly, and let your unit economics decide where your next ad dollar goes.
Make your next split easier
This framework gives you a starting split. The hard part is tracking creative fatigue, spotting what competitors are testing, and catching CAC drift before it eats your margin.
Atria pulls that data automatically across Meta and TikTok, so your next split is based on this month's numbers. Radar (its ad grader) grades your ads and flags what needs fixing, and Raya (AI creative strategist) turns that into your next brief, pulling in competitor intel.
Frequently asked questions
Is TikTok cheaper than Facebook?
Usually, yes, TikTok typically runs a lower CPM than Facebook, although its CPC edge is less consistent. Meta's algorithm often pulls higher intent and higher conversion rates, so your final cost per purchase can land at about the same place, depending on your product.
Which platform converts better?
Facebook converts better than TikTok, generally, for direct, immediate last-click sales, especially for considered purchases or an audience over 35.
TikTok wins on top-of-funnel discovery and impulse buys, but its path to purchase often runs through multiple touchpoints and a search-assisted lookup before anyone buys.
Should I run both platforms?
Yes, you should run both platforms if your monthly budget clears $10,000 and you can produce at least 3 to 5 net-new video assets per week. When you do, Meta captures your retargeting and high-intent demand while TikTok introduces your brand to fresh audiences at a lower impression cost.
How often should I revisit the budget split?
Revisit your budget split every 30 days. Recalculate sooner if your creative capacity shifts, your blended CAC creeps toward your margin limit, or you hit a seasonal sales period where auction CPMs swing.